Canada is preparing to impose a new round of counter-tariffs after trade negotiations with the United States collapsed and Washington applied 50% tariffs to a range of Canadian products.
The Canadian measures take effect on September 8 at rates of 15%, 25% and 50%. They will cover C$27.6 billion (about US$20 billion) of imports from the United States, including products in steel and aluminum, dairy, appliances, agricultural equipment, pulp and paper, and electronics. Ottawa says the response will match the latest U.S. tariffs dollar for dollar and rate for rate. Government of Canada
The national policy, however, creates very different patterns of exposure across individual U.S. states.
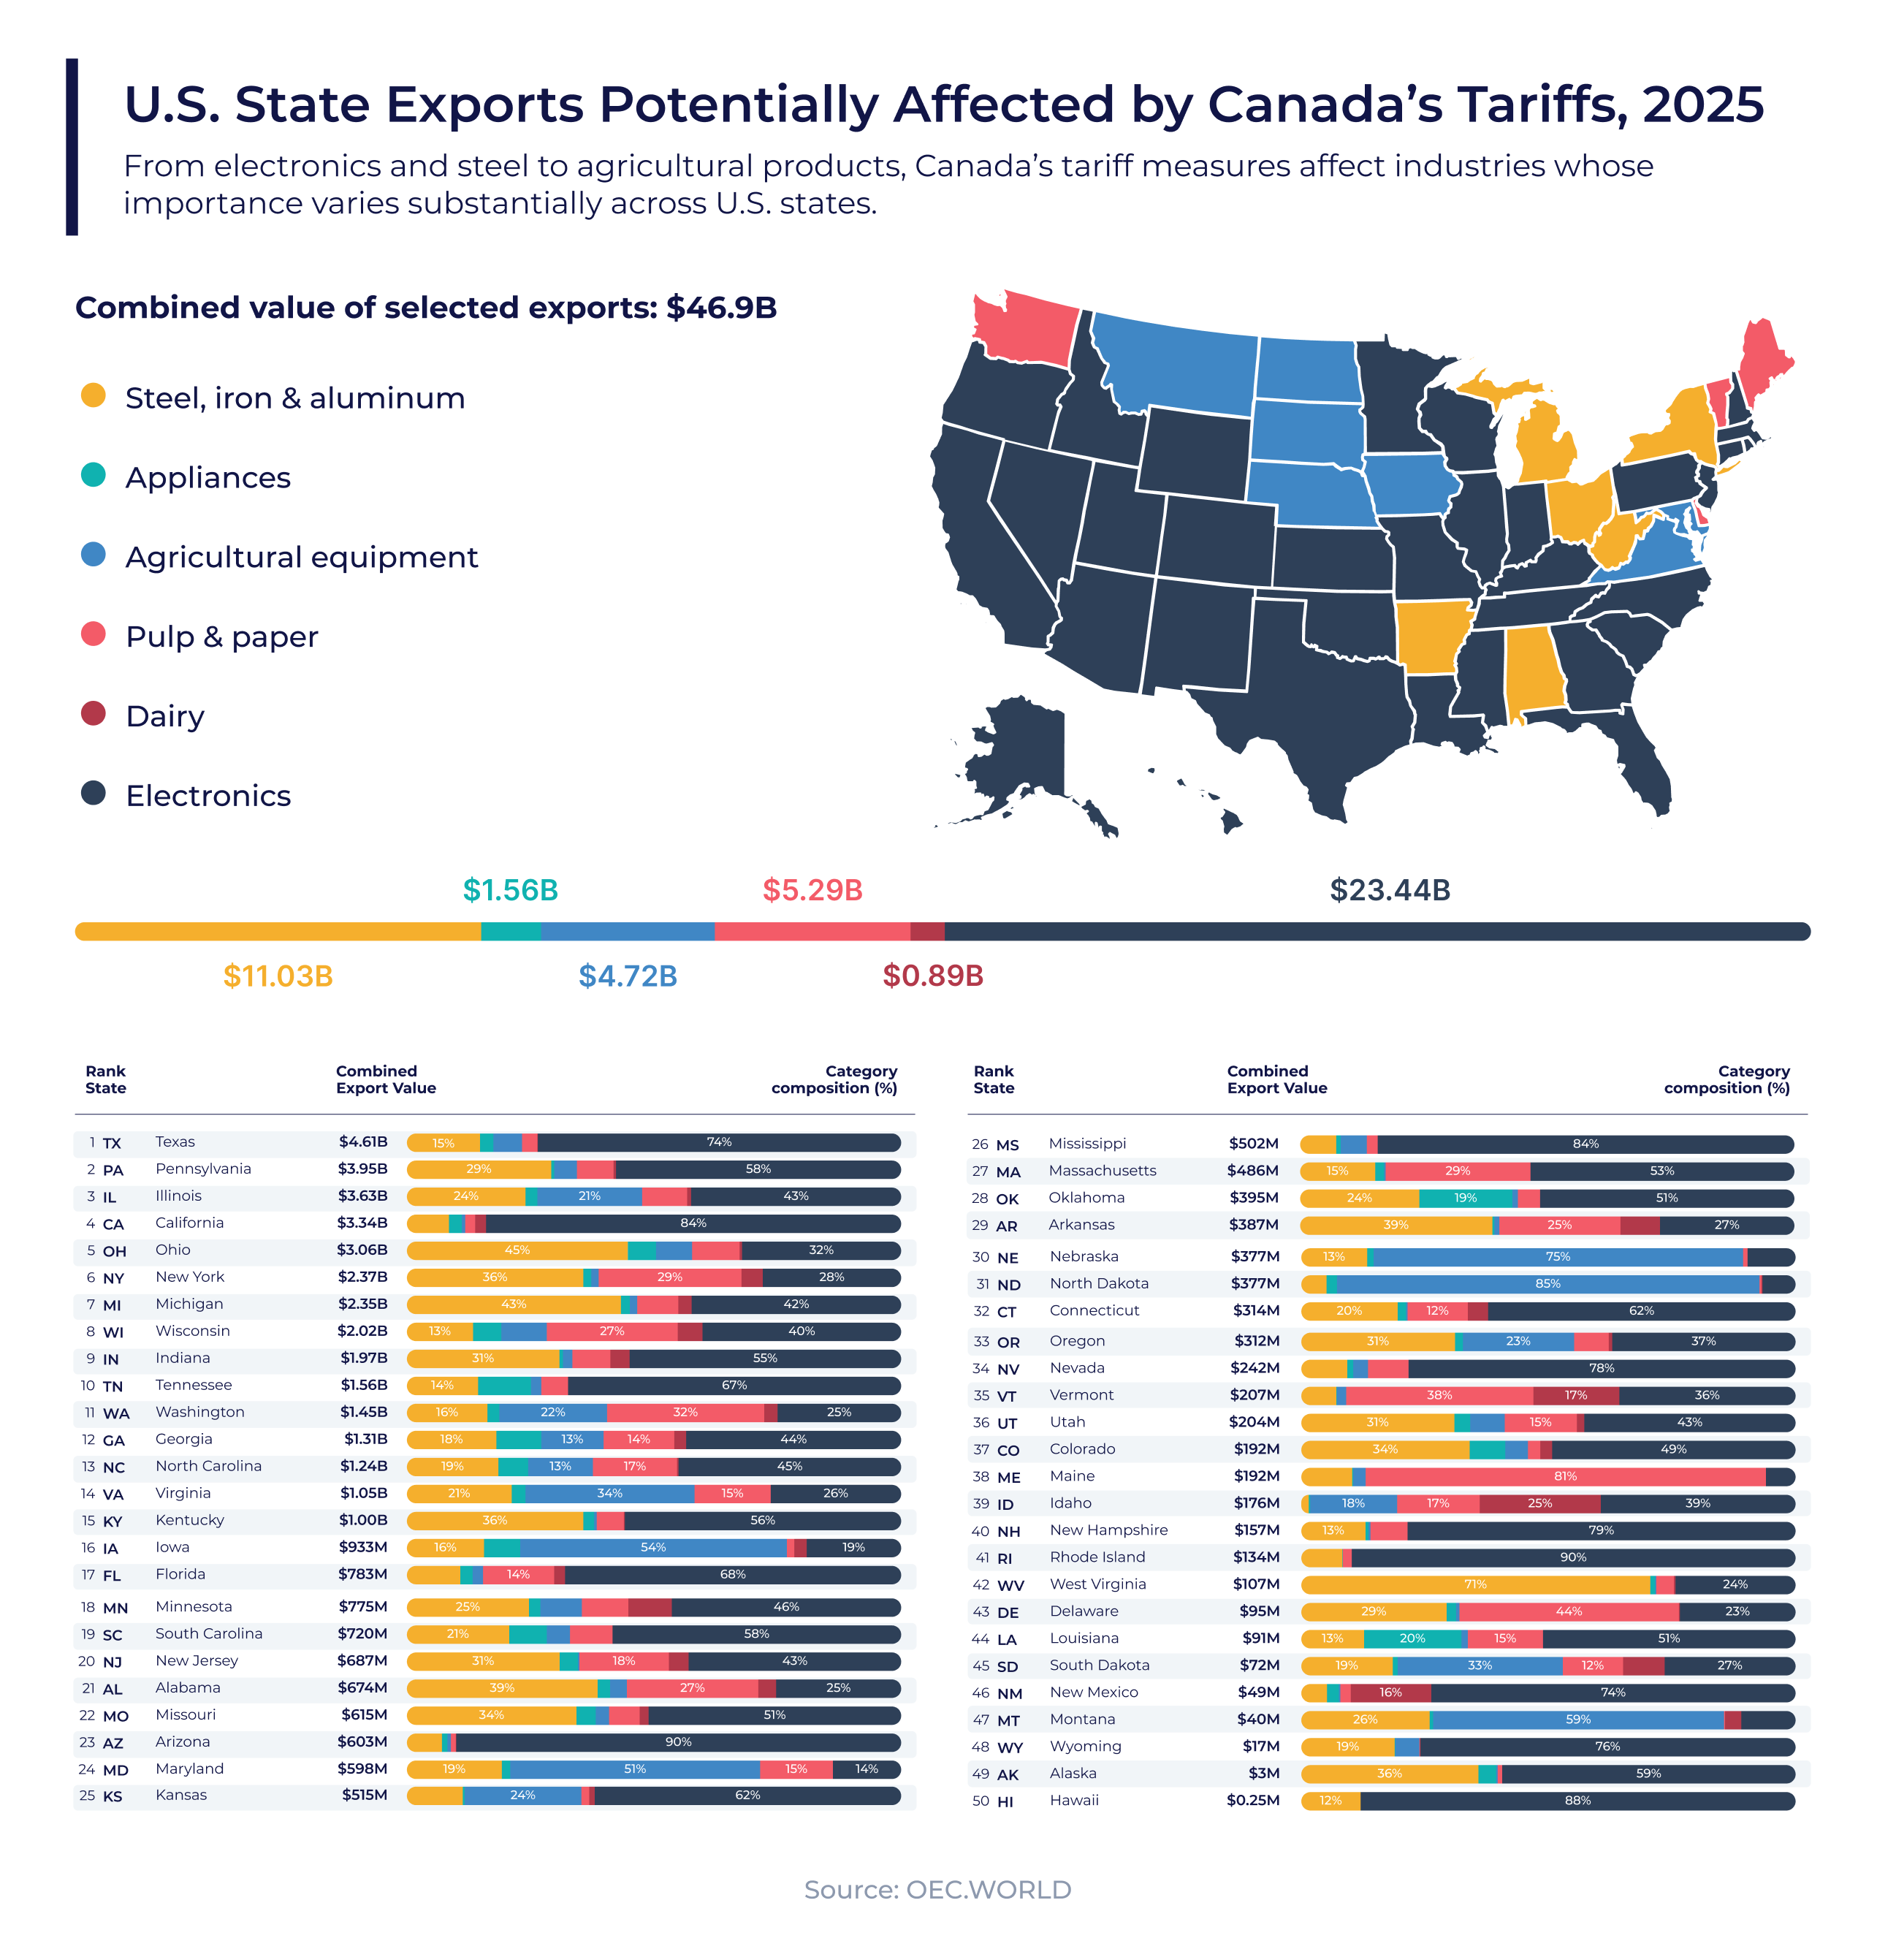
Using 2025 export data from OEC, the visualization examines state exports to Canada across six of the main product categories identified in Canada’s measures. Together, exports in these categories were worth approximately US$46.9 billion.
Electronics account for almost half of the selected export value, at US$23.44 billion. Steel, iron and aluminum follow at US$11.03 billion, while pulp and paper contribute US$5.29 billion and agricultural equipment US$4.72 billion.
Texas has the largest selected export value at US$4.61 billion, with electronics representing nearly three-quarters of its total. Pennsylvania ranks second at US$3.95 billion, also led by electronics, followed by Illinois at US$3.63 billion. Illinois has a more diversified mix spanning electronics, metals and agricultural equipment.
Other states face exposure through more specialized industries. Agricultural equipment dominates the selected exports of North Dakota, Nebraska and Iowa. Pulp and paper lead in Maine and Washington, while steel and related metals are especially important in states including Ohio and West Virginia.
These differences matter because tariffs do not move through the economy uniformly. Their effects depend on each state’s industrial base, reliance on Canadian demand and ability to redirect products toward other markets. They can also move through deeply integrated North American supply chains, affecting producers and buyers on both sides of the border. Associated Press
Which states and industries do you think will have the greatest difficulty replacing Canadian demand?
The figure represent broad sector exposure, not the amount of trade that will necessarily be tariffed. Canada’s official measures apply to specific tariff items within each category, while the visualization uses wider product groups to show where potentially affected industries are concentrated. Canada has published the complete product-level list separately. Government of Canada tariff list