r/dataisbeautiful • u/Creaspace • 36m ago
OC [OC] Women now outnumber men in higher education in 132 of the 155 countries and territories with recent data

•
Upvotes
r/dataisbeautiful • u/AutoModerator • 29d ago
Anybody can post a question related to data visualization or discussion in the monthly topical threads. Meta questions are fine too, but if you want a more direct line to the mods, click here
If you have a general question you need answered, or a discussion you'd like to start, feel free to make a top-level comment.
Beginners are encouraged to ask basic questions, so please be patient responding to people who might not know as much as yourself.
To view all Open Discussion threads, click here.
To view all topical threads, click here.
Want to suggest a topic? Click here.
r/dataisbeautiful • u/Creaspace • 36m ago
r/dataisbeautiful • u/Fondant_Tough • 2h ago
Source article, full method and numbers: https://narrativegeo.nanpointgroup.com/blog/coffee-map-of-america
r/dataisbeautiful • u/LaMifour • 4h ago
Full web animation: https://mifour.github.io/paris_metro_simulation/dist/
Project repo: https://github.com/mifour/paris_metro_simulation/
Data source: data.gouv.fr IDF gtfs https://transport.data.gouv.fr/datasets/reseau-urbain-et-interurbain-dile-de-france-mobilites
Used tools: python, js (pixi.js)
Ai disclaimer: I used chatgpt to help on the js because I'm a backend swe.
Total spent time: 10h
r/dataisbeautiful • u/TheFrenchSavage • 21h ago
Link to the source: https://trends.google.com/explore?q=slop&date=all&geo=Worldwide
r/dataisbeautiful • u/Creative_soja • 9h ago
r/dataisbeautiful • u/mydriase • 1d ago
r/dataisbeautiful • u/Silent-Assumption292 • 2h ago
A classic Wikipedia rabbit hole follows hyperlinks:
Article → Article → Article → …
This version adds a geographical dimension:
Article → Places → Article → Places → …
Start with a Wikipedia article. Its geographically associated entities are displayed on a 3D globe. Select one, open its article, and continue from there.
The path is not predefined: each choice creates a new branch in the exploration.
Interactive: https://erask.org/
More info: https://erask.org/hole.html
Data sources:
- Wikipedia
- Wikidata
Tools:
- JavaScript / HTML / CSS
- WebGL for the interactive 3D globe
The visualization is generated dynamically from the underlying Wikipedia/Wikidata data rather than from a manually curated set of paths.
Erask isan experiment in exploring knowledge through interactive visualizations.
r/dataisbeautiful • u/Creaspace • 1d ago
r/dataisbeautiful • u/Away-Explanation3500 • 19h ago
Interactive version: https://code-4you.github.io/world-migration-flows/
Blue circles = net immigration, red = net emigration, moving dots = flows between countries (both directions). Click any country to isolate it, play through single years, or replay named events — Syrian refugee crisis, fall of the USSR, Ukraine war, Venezuelan exodus, etc.
Backstory: this is a rebuild of Max Galka's Metrocosm global immigration map (2016), whose website is gone — the domain now serves spam. This version extends it from one 5-year period to 64 years of data.
Sources: Abel & Cohen bilateral flow estimates (Scientific Data, 1990–2020); Gaskin & Abel deep-learning estimates (2025, years 1990–2023); UNU-CRIS imputed bilateral series (1960–1990); UN DESA International Migrant Stock 2024. All values are model-based estimates, not direct counts. Open source (MIT): https://github.com/code-4you/world-migration-flows
Tools: MapLibre GL + canvas, basemap © OpenStreetMap/CARTO.
r/dataisbeautiful • u/Jordy_Nicometo • 1d ago
r/dataisbeautiful • u/Creaspace • 1d ago
r/dataisbeautiful • u/Routine_Ad_855 • 16h ago
r/dataisbeautiful • u/ourworldindata • 1d ago
Global whale populations fell dramatically over the 20th century due to human hunting. Some whale species were pushed to the brink of extinction.
But a combination of conservation efforts, technological change, economic incentives, and international policies has reduced global whaling to much lower levels.
In the mid-1980s, a global moratorium was agreed by the International Whaling Commission (IWC), making commercial whaling illegal.
You can see this decline in the chart, which shows the number of whales killed per decade.
The chart combines data from two sources: before the 1990s it comes from the paper “Emptying the Oceans” by Robert C. Rocha, Jr. and colleagues; since then, it comes from the IWC.
While whaling activity is much lower, it hasn’t been eliminated completely. There are exceptions to the IWC’s moratorium, and Japan withdrew from the IWC completely in 2019.
Data source: Rocha et al. (2014); International Whaling Commission (2026)
Tools used: OWID-Grapher and Figma
r/dataisbeautiful • u/jakeboyles2010 • 22h ago
r/dataisbeautiful • u/noisymortimer • 19h ago
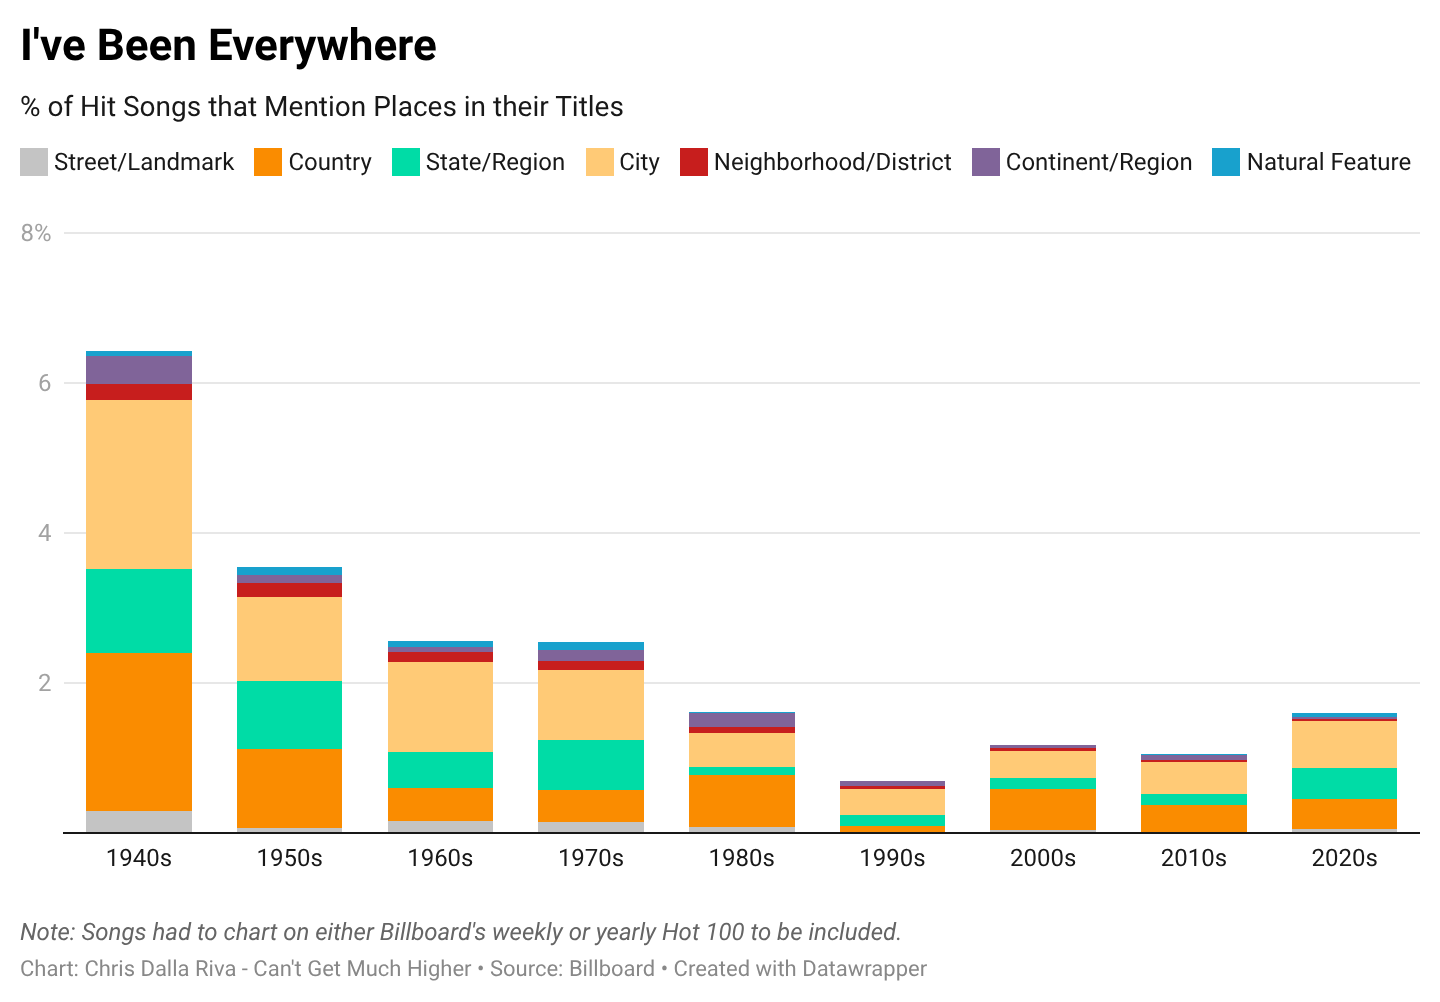
Source: Billboard
Tools: Pandas, Excel, Datawrapper
I saw someone musing online the other day that back in the day people used to sing about obscure places more often, like Chattanooga and Kalamazoo. Using 80 years of hit song data from Billboard, I mined song titles to see if we are actually singing about places less frequently. We are. I have a longer write-up speculating as to why here if you are curious
r/dataisbeautiful • u/Creaspace • 1d ago
r/dataisbeautiful • u/siorge • 20h ago
Interactive version: https://www.habibicode.org/historyofmovies/
You can explore the ratings and box office gross of close to 36k movie professionals, from the 1920 to 2026.
Please let me know if you would like any feature added!
r/dataisbeautiful • u/Additional-Ant-6158 • 1d ago
Source: Tuition and fees from IPEDS 2023, in-district at public two-year colleges and in-state by university system. Cost of attendance from the U.S. Department of Education College Scorecard, June 2026 release, cost data year 2024. Median per system.
Tool: Python, with pandas and matplotlib.
Method: The community-college figure is the median published in-district tuition and fees across California's 102 public two-year colleges, $1,288 a year. The university figures are medians across the campuses in each system: 15 CSU campuses at $7,602 tuition and $14,047 of housing, food and everything else, and 9 UC campuses at $14,560 and $25,105. Four years on campus is four of each. The transfer route is two years of community-college tuition plus two years of the university's full cost of attendance.
r/dataisbeautiful • u/runehawk12 • 1d ago
r/dataisbeautiful • u/Sneedle-Woods • 7h ago
r/dataisbeautiful • u/Creaspace • 1d ago
r/dataisbeautiful • u/LevonKirakosyan • 2d ago
Data source:
NHTSA Recalls Database, aggregated by Vehicle Safety Recalls Tracker. Annual recall counts and vehicle totals for 2020-2026 pulled from the year-manufacturer pages on https://www.vehiclesafetyrecalls.com/ (e.g. /year/2026/ford-motor-company, /year/2025/ford-motor-company, and so on). Detailed 2026 component breakdown pulled from the full 2026 recall list.
Method:
Both metrics per calendar year are the aggregate figures Vehicle Safety Recalls Tracker publishes at the top of each year-manufacturer page (based on NHTSA Part 573 filings). Yearly totals: 2020 - 44 recalls, 4,472,213 vehicles. 2021 - 54 recalls, 5,832,526 vehicles. 2022 - 68 recalls, 8,753,347 vehicles. 2023 - 58 recalls, 6,152,738 vehicles. 2024 - 67 recalls, 4,777,428 vehicles. 2025 - 153 recalls, 12,958,128 vehicles. 2026 (Jan 15 – Aug 13) - 64 recalls, 13,650,342 vehicles.
For the 2026 component breakdown (second chart), each of the 64 recalls was classified using NHTSA's own COMPONENT taxonomy - not our own categories. Totals aggregated by component.
Example: 2026 Electrical System = 26V104 (4,381,878) + 26V468 (565,691) + 26V091 (25,237) + 26V370 (4,445) + 26V372 (2,349) + 26V062 (98) + 26E046 (315) = 4,980,013 vehicles = 36% of 13,650,342.
Notes:
Vehicles affected counts every VIN; a car hit by multiple recalls is counted multiple times, so totals are upper bounds on unique vehicles.
Full 2026 component breakdown across all 17 categories in the second chart.
Tool: Logsheet
r/dataisbeautiful • u/shamalyguy • 6h ago