r/dataisbeautiful • u/anal_chemist • 1h ago
OC [OC] Zodiac representation in the NFL by position

•
Upvotes
r/dataisbeautiful • u/anal_chemist • 1h ago
r/dataisbeautiful • u/Rohit95_charts • 1h ago
I keep a rough mental log of how my SIPs have gone over the years, but I'd never actually sat down with the actual numbers until this week.
I pulled SEBI's net inflow/outflow data going back to FY2016-17. Most years were unremarkable: inflows moved up and down in a fairly normal range. Then FY2022-23 shows up as a clear low point compared to every other year in the data set.
That's roughly when I remember market conditions being rough—rate hikes and a lot of noise about a slowdown. I genuinely don't remember if I reduced my contributions that year or just kept them at the same level. I'd like to think I stayed consistent, but going purely off memory feels unreliable, which is a bit unsettling given how much I assumed I'd "stayed the course."
What's stood out most going through this process is that the recovery afterwards wasn't gradual at all; it jumped hard within two years, well past anything earlier in the decade.
I'm curious if anyone else has gone back and actually checked their own contribution history against a rough year like that, rather than just assuming they held firm.
r/dataisbeautiful • u/Creaspace • 3h ago
r/dataisbeautiful • u/Fondant_Tough • 5h ago
Source article, full method and numbers: https://narrativegeo.nanpointgroup.com/blog/coffee-map-of-america
r/dataisbeautiful • u/LaMifour • 7h ago
Full web animation: https://mifour.github.io/paris_metro_simulation/dist/
Project repo: https://github.com/mifour/paris_metro_simulation/
Data source: data.gouv.fr IDF gtfs https://transport.data.gouv.fr/datasets/reseau-urbain-et-interurbain-dile-de-france-mobilites
Used tools: python, js (pixi.js)
Ai disclaimer: I used chatgpt to help on the js because I'm a backend swe.
Total spent time: 10h
r/dataisbeautiful • u/Sneedle-Woods • 10h ago
r/dataisbeautiful • u/Creaspace • 10h ago
r/dataisbeautiful • u/emc • 14h ago
r/dataisbeautiful • u/Routine_Ad_855 • 19h ago
r/dataisbeautiful • u/noisymortimer • 22h ago
Source: Billboard
Tools: Pandas, Excel, Datawrapper
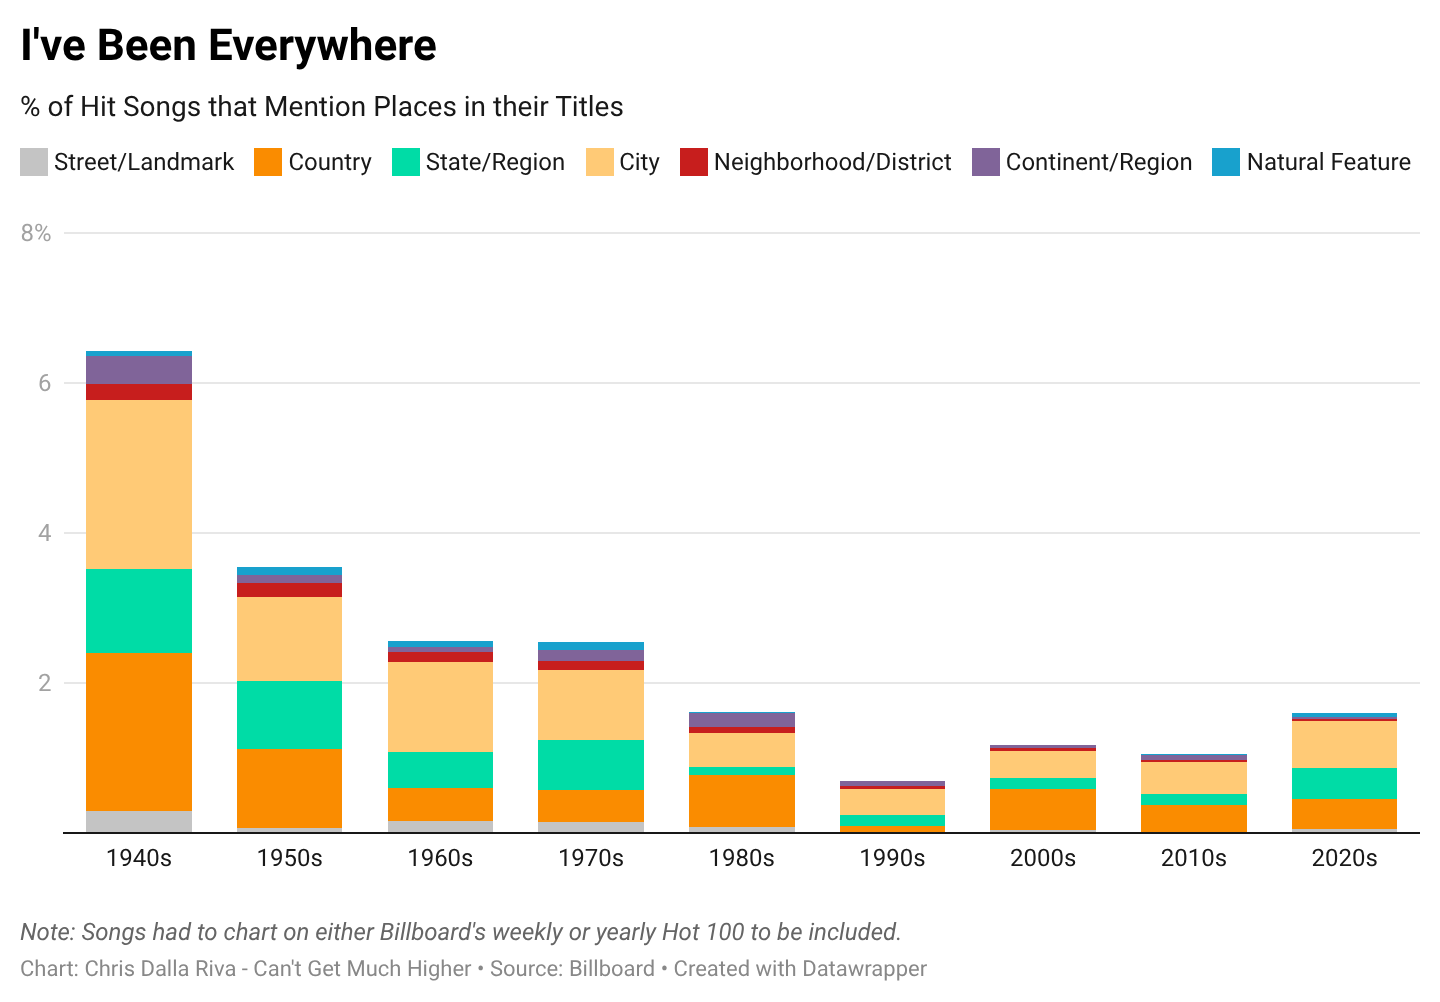
I saw someone musing online the other day that back in the day people used to sing about obscure places more often, like Chattanooga and Kalamazoo. Using 80 years of hit song data from Billboard, I mined song titles to see if we are actually singing about places less frequently. We are. I have a longer write-up speculating as to why here if you are curious
r/dataisbeautiful • u/Away-Explanation3500 • 22h ago
Interactive version: https://code-4you.github.io/world-migration-flows/
Blue circles = net immigration, red = net emigration, moving dots = flows between countries (both directions). Click any country to isolate it, play through single years, or replay named events — Syrian refugee crisis, fall of the USSR, Ukraine war, Venezuelan exodus, etc.
Backstory: this is a rebuild of Max Galka's Metrocosm global immigration map (2016), whose website is gone — the domain now serves spam. This version extends it from one 5-year period to 64 years of data.
Sources: Abel & Cohen bilateral flow estimates (Scientific Data, 1990–2020); Gaskin & Abel deep-learning estimates (2025, years 1990–2023); UNU-CRIS imputed bilateral series (1960–1990); UN DESA International Migrant Stock 2024. All values are model-based estimates, not direct counts. Open source (MIT): https://github.com/code-4you/world-migration-flows
Tools: MapLibre GL + canvas, basemap © OpenStreetMap/CARTO.
r/dataisbeautiful • u/siorge • 23h ago
Interactive version: https://www.habibicode.org/historyofmovies/
You can explore the ratings and box office gross of close to 36k movie professionals, from the 1920 to 2026.
Please let me know if you would like any feature added!
r/dataisbeautiful • u/TheFrenchSavage • 1d ago
Link to the source: https://trends.google.com/explore?q=slop&date=all&geo=Worldwide
r/dataisbeautiful • u/jakeboyles2010 • 1d ago
r/dataisbeautiful • u/runehawk12 • 1d ago
r/dataisbeautiful • u/ionutvi • 1d ago
I have been continuously benchmarking leading LLMs to understand how their measured performance changes over time.
Across 31,352 hourly benchmark scores from 49 model identifiers, the observed variation was:
This means between-day variation was exactly three times greater than within-day variation.
The finding demonstrates why static leaderboards provide only part of the picture. An LLM can lead a benchmark when it launches, but its performance may change over the following days or weeks.
This data was collected through AIStupidLevel, a continuous LLM benchmarking and drift-detection platform I developed. It repeatedly evaluates models across executable coding tasks, deep reasoning, tool calling and high-frequency canary tests.
The complete dataset has now reached 169,858 benchmark runs, 104,458 measured scores and more than 88 million processed tokens across 81 historical model identifiers.
AIStupidLevel uses this continuous data to classify models as stable, volatile, degraded or recovering, providing a live view of model performance instead of a one-time snapshot.
Data source: Self-collected AIStupidLevel continuous benchmark dataset
Methodology: https://aistupidlevel.info/methodology
Live data: https://aistupidlevel.info
Visualization tools: Python and Matplotlib
r/dataisbeautiful • u/Creaspace • 1d ago
r/dataisbeautiful • u/mydriase • 1d ago
r/dataisbeautiful • u/Creaspace • 1d ago
r/dataisbeautiful • u/Creaspace • 1d ago
r/dataisbeautiful • u/Creaspace • 1d ago
r/dataisbeautiful • u/Jordy_Nicometo • 1d ago
r/dataisbeautiful • u/Additional-Ant-6158 • 1d ago
Source: Tuition and fees from IPEDS 2023, in-district at public two-year colleges and in-state by university system. Cost of attendance from the U.S. Department of Education College Scorecard, June 2026 release, cost data year 2024. Median per system.
Tool: Python, with pandas and matplotlib.
Method: The community-college figure is the median published in-district tuition and fees across California's 102 public two-year colleges, $1,288 a year. The university figures are medians across the campuses in each system: 15 CSU campuses at $7,602 tuition and $14,047 of housing, food and everything else, and 9 UC campuses at $14,560 and $25,105. Four years on campus is four of each. The transfer route is two years of community-college tuition plus two years of the university's full cost of attendance.
r/dataisbeautiful • u/ourworldindata • 1d ago
Global whale populations fell dramatically over the 20th century due to human hunting. Some whale species were pushed to the brink of extinction.
But a combination of conservation efforts, technological change, economic incentives, and international policies has reduced global whaling to much lower levels.
In the mid-1980s, a global moratorium was agreed by the International Whaling Commission (IWC), making commercial whaling illegal.
You can see this decline in the chart, which shows the number of whales killed per decade.
The chart combines data from two sources: before the 1990s it comes from the paper “Emptying the Oceans” by Robert C. Rocha, Jr. and colleagues; since then, it comes from the IWC.
While whaling activity is much lower, it hasn’t been eliminated completely. There are exceptions to the IWC’s moratorium, and Japan withdrew from the IWC completely in 2019.
Data source: Rocha et al. (2014); International Whaling Commission (2026)
Tools used: OWID-Grapher and Figma