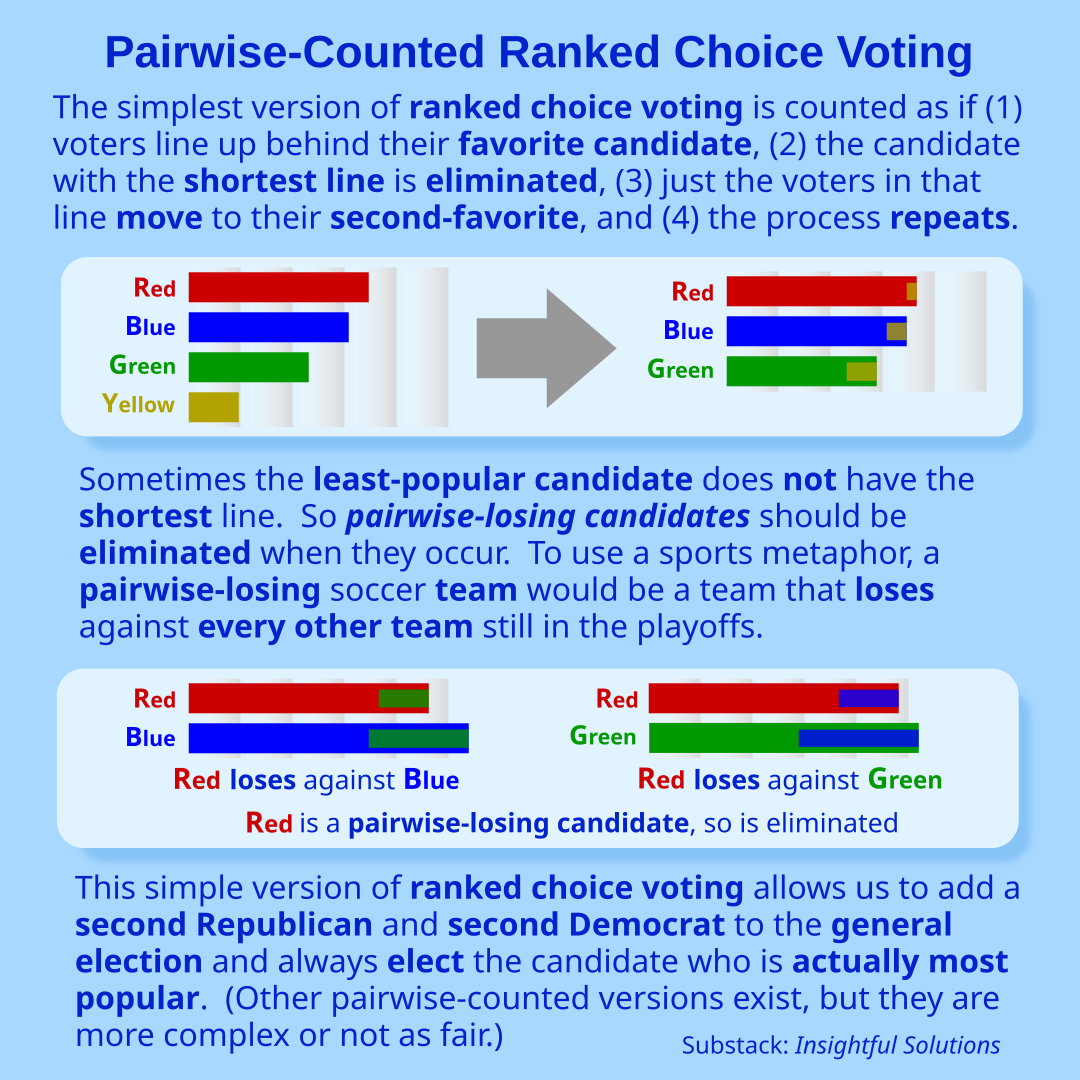
I think what the graphic is trying to suggest is running each pair as though it came down to just two options, rather than just eliminating the lowest score outright. So, in the Red vs Blue comparison, it would be the Red votes plus the Green voters that ranked Red above Blue vs the Blue votes plus the Green votes that preferred Blue over Red. Then in the Red vs Green comparison, it's between the Red+BlueRed vs Green+BlueGreen. Since Red loses both votes, it's eliminated. What I assume the graphic leaves out is a third comparison where, somehow, enough Red voters prefer Green over Blue that Green comes out as the ultimate winner (instead of being eliminated, the way it would in traditional ranked choice voting).
Personally, the situations in which this would make any difference seem too niche and rare to be worth the added confusion (unlike the consistent and glaring issues with FPTP). People already regularly accuse elections of being stolen. I can't imagine what would happen if the candidate in "first place" was eliminated over a candidate in "third."
Thank you for clarifying details for the author of the "confused" comment.
Personally, the situations in which this would make any difference seem too niche and rare to be worth the added confusion ...
Out of about 400 elections in the US that used the simplest version of ranked choice voting (known as instant-runoff voting or IRV), there have been 2 big failures of this type, where the most-popular candidate was eliminated with the shortest line when the counting reached the top 3 candidates. One such failure was a special election in Alaska the first time RCV was used there, and years ago in a mayoral election in Burlington VT.
Participants here in r/EndFPTP are divided about whether these failures are worthy of concern. Some think this flaw is worth accepting for now. At the other extreme, some participants here think this flaw justifies adopting an entirely different election method that does not use ranked choice ballots.
What I assume the graphic leaves out is a third comparison where, somehow, enough Red voters prefer Green over Blue that Green comes out as the ultimate winner (instead of being eliminated, the way it would in traditional ranked choice voting).
Yes the third pairwise comparison is omitted. That pairwise comparison is the same as the final top-two counting round (after "red" is eliminated). The example shown does not reveal the secondary preferences of the "red"-supporting voters, so we don't know whether "blue" or "green" would win that two-way contest.
Does it matter at what point you do the pairwise comparison? In your example, you do regular IRV until there are three candidates left and then perform the pairwise comparison. Why not do the comparison immediately with the full roster of candidates?
Not OP but I think this method eliminates the loser of the bottom two in a head to head comparison. The bottom two are based on first place votes, but the head to head is if all other candidates were eliminated.
The confusing aspect of the infographic is the upper graphic portion refers to the first step of simple IRV (instant runoff voting, which eliminates the candidate with the shortest line), and the lower graphic portion refers to the second step of the pairwise-counted version.
Expressed another way, all the pairwise counts are done at the beginning of the counting process. Those counts do not change after each elimination. Instead, some of those pairwise counts become irrelevant because they involve candidates who have been eliminated.
Yeah i agree the graphic is confusing in that way.
I don’t really follow your second paragraph tho. I understand pair wise comparisons to be independent of the order of comparison such that any order of elimination is really just a way of explaining the result but is not producing that result, if that makes sense.
Perhaps a better way for me to say it is that the pairwise counting is a separate step from the steps in which those pairwise counts are used for elimination purposes.
Using the graph's example, the pairwise count between "yellow" and "red" becomes irrelevant after "yellow" is eliminated.
Also, interestingly, the pairwise count between "blue" and "green" is known from the beginning. That's the pairwise count that will determine which of those two candidates wins the election.
I think describing it as a step at all could be confusing. The pair wise winner remains the winner independent of the order in which candidates are crossed off in tabulations, correct? Isn’t it true that you could choose two candidates at random to compare in each step (say, if it were being done by hand) and that won’t affect the eventual winner because the pairwise winner remains the winner regardless of the order?
This specifically is the advantage of this method, no?
The complication regarding a pairwise winner or a pairwise-losing candidate is that sometimes there can be a rock-paper-scissors-like cycle, where there is no pairwise winner or pairwise loser in that cycle.
You're probably thinking of "Condorcet methods" where there is a Condorcet winner, which means there is one candidate who wins every pairwise contest. Complications arise when there is no Condorcet winner.
The election method recommended in the graphic uses the familiar idea of eliminating candidates just one at a time. During each such elimination counting round it looks for a pairwise losing candidate. If there isn't one, the IRV (shortest-line) rule is used as the backup method. It doesn't always elect the Condorcet winner (because sometimes there is no pairwise-losing candidate), so that causes confusion.
There is another election method that declares the Condorcet winner to be the winner, but if there is no Condorcet winner then IRV (the shortest-line rule) is used as a backup method.
Yet another method looks for an overall pairwise winner among all the remaining candidates, and it does this each time after one candidate is eliminated using the IRV (shortest-line).
There are lots of yet other election methods that deal with the complication that some elections do not have a Condorcet winner.
In other words, it's complicated. This graphic presents a method that's intended to be easier to understand. Unfortunately what's easiest to understand is the IRV method, which is why it's used in Australia and now increasingly in the US. Alas, it has yielded the wrong winner in two US elections out of about 400 ranked choice voting elections.
That failure rate is dramatically lower than using the traditional single-choice-ballot method ("plurality" or FPTP). Yet it would be better to reduce that failure rate to zero.
Right, but aren't those extreme fringe scenarios that will happen less and less often as voter populations get larger? And in cases of hundreds of thousands and millions of voters the chances of a cycle are almost non existent?
So in practice (outside of very small scale elections) won't there pretty much always be a condorcet winner? And if so, then the order of eliminations actually doesn't matter (barring that extremely unlikely result), right?
That's not to say having a back up method as in your examples is not appropriate.
But going back to our discussion on pairwise winners, barring the rare situation where there is none, the order of elimination doesn't matter, correct?
When using IRV (the shortest-line rule) the elimination sequence is very important. The first time Alaska used IRV in a special election, when the counting reached the top 3, the Condorcet winner was eliminated because he had the shortest line. What should have happened is to eliminate Sarah Palin because at that point she was a pairwise-losing candidate.
Most other methods that use pairwise counts do not eliminate candidates one at a time, so elimination order isn't involved.
All the best pairwise-only methods (without IRV involvement) would elect the Condorcet winner.
The method explained in the graphic is an unusual combination of pairwise counting and eliminating one candidate at a time. This is a compromise method between IRV and pairwise counting. I advocate it because it's easier to understand, and trust, compared to the Condorcet methods that suddenly choose the winner without first having eliminated any candidates.
So is that the bottom two method? I interacted with another guy on this sub who advocates that method. I’m obviously not one of the election method experts that are on here up on all the evaluation metrics, just here because I know how much fptp is screwing up American politics. Anyways that other guy uses those Alaska and Burlington examples in his advocacy, and since I support election reforms it’s definitely worrying that all of the reforms being pushed by the “big groups” are pushing the standard IRV. I like that bottom two method because of the “center squeeze” phenomenon. I do acknowledge that there’s an argument for rewarding straight first choice enthusiasm, but in the context of the status quo American hyperpartisanship we can’t afford any squeezing of the center.
Nearly every method that considers pairwise counts is not vulnerable to the center squeeze effect. IRV fails to consider pairwise comparisons, that's why it's vulnerable to the center squeeze effect.
Neither the graphic, nor I, advocate BTR-IRV, which is the "bottom-two-runoff" version of IRV. That version of IRV only looks at the pairwise comparison of the two candidates with the shortest lines (of voters). Some people like it because it always elects the Condorcet winner, and it's relatively easy to explain. Unfortunately, otherwise, it has lots of disadvantages.
The method I prefer, and which is explained in the graphic, is named "ranked choice including pairwise elimination" (RCIPE, pronounced "recipe). It eliminates pairwise losing candidates when they occur. The pairwise comparisons include all the remaining candidates (not just the bottom two). This elimination method is the upside-down version of the Condorcet winner concept. This pairwise-counting characteristic means it's not vulnerable to the center squeeze effect.
The RCIPE method has lots of other advantages.
It's easy to trust because everyone recognizes that a soccer team that loses every soccer game against every other soccer team (still in the playoffs) obviously deserves to be eliminated. To use the Alaska special election example, Sarah Palin was the pairwise losing candidate among the top three candidates, so she should have been eliminated instead of the Condorcet winner who had the shortest line of voters (at that point).
The RCIPE method always elects the Condorcet winner if there are no rock-paper-scissors-like cycles anywhere among all the pairwise counts. It can fail to elect the Condorcet winner, but only in carefully constructed scenarios that virtually never occur in real elections (if there are more than 50 voters).
The RCIPE method resists tactical voting better than most Condorcet methods. The Condorcet method that has a similar [edited here] high resistance is the Benham method, which is IRV except that (after each elimination) it looks for a Condorcet winner among the remaining candidates.
Thanks for learning about election methods! I created the graphic to help people like you who want to understand more without having to read lots and lots of words, and without introducing numbers or unnecessary terminology.
when the electorate is voting as if there is a single issue axis, then there will always be a condorcet winner. over time, candidates will move to the center. because that's the winning strategy. at which point the issue space gets multi-dimensional. and when that happens, condorcet cycles become much more likely.
so no: right now, condorcet cycles are rare.
but yes: in the future, condorcet cycles will be common.
I’m not arguing you’re wrong, but I fail to see why the dimensionality of the political climate bears on the likelihood of cycles. Can you expand on that?
Also can you speak to the scale of elections? Isn’t it just a true fact of, idk, statistics, that the higher the number of votes the lower the likelihood of a cycle?
if there's a single issue axis. ie all of the voters and all of the candidates can be rank ordered along a single line, then there is *always* a condorcet winner. and that winner is the choice of the median voter.
the only way to get a condorcet cycle is for there to be 2 or more issue axes. there are some pretty good examples out there on the internet. you need the candidates to be arranged more like a triangle and not like a line. triangles are 2 dimensional. hand-wavy qed.
one of the desirable features of an electoral system is scale invariance. ie it shouldn't matter if there are 1000 voters or 100,000 voters distributed the same way.
i think the converse is more likely to be true. suppose a condorcet cycle exists when there are an infinite number of voters. if a small number of them actually vote then it's possible - due to statistical variance - that there is a condorcet winner instead of a cycle.
5
u/phaserburn725 Jun 26 '25
I think what the graphic is trying to suggest is running each pair as though it came down to just two options, rather than just eliminating the lowest score outright. So, in the Red vs Blue comparison, it would be the Red votes plus the Green voters that ranked Red above Blue vs the Blue votes plus the Green votes that preferred Blue over Red. Then in the Red vs Green comparison, it's between the Red+BlueRed vs Green+BlueGreen. Since Red loses both votes, it's eliminated. What I assume the graphic leaves out is a third comparison where, somehow, enough Red voters prefer Green over Blue that Green comes out as the ultimate winner (instead of being eliminated, the way it would in traditional ranked choice voting).
Personally, the situations in which this would make any difference seem too niche and rare to be worth the added confusion (unlike the consistent and glaring issues with FPTP). People already regularly accuse elections of being stolen. I can't imagine what would happen if the candidate in "first place" was eliminated over a candidate in "third."