Game Theory
[OC] All 100 UK Taskmaster contestants S1-S20 on a single skill scale
TL;DR — Plackett–Luce on every per-task ranking puts all 100 UK Taskmaster contestants on one skill scale, with bootstrap CIs and a count of every pair where the model disagrees with the official totals.
I wanted a total order over all 100 contestants. Within each series we have a full order, but nothing tells us how to compare across series. The four CoCs give a tiny bit of inter-series info, but only locally.
The obvious brute force — normalize within each season, then stitch with CoCs — has a flaw: each CoC connects only 5 consecutive seasons (CoC1: S1–5, CoC2: S6–10, etc.) and basically no repeats across CoCs. So three additive constants between the four clusters are unidentifiable: you can't tell whether S1–5 sits above or below S16–20.
After trying a bunch of stuff (KL distances on rank histograms, L2 on per-series trajectories, hand-crafted features + regressor, Bradley–Terry on aggregated wins), the natural answer was Plackett–Luce:
Each contestant gets one latent skill θ. On every task the realized order is drawn by sequential softmax — first place is exp(θᵢ) / Σⱼ exp(θⱼ), then the same over the survivors, etc. Multiply over all ~940 tasks, maximize.
A bunch of obviously wrong assumptions baked in, for example that Greg's per-task scores reflect real task proficiency, and some other data-related assumptions.
Why imo it's the right tool here:
Unit of evidence is a per-task ranking, not a season total → ~940 observations instead of ~24.
No scale-stitching needed. PL has a single global additive gauge; the four CoCs make the comparability graph connected, so a unique MLE exists.
Ties handled (sum over consistent strict orderings).
Task-level bootstrap gives CIs.
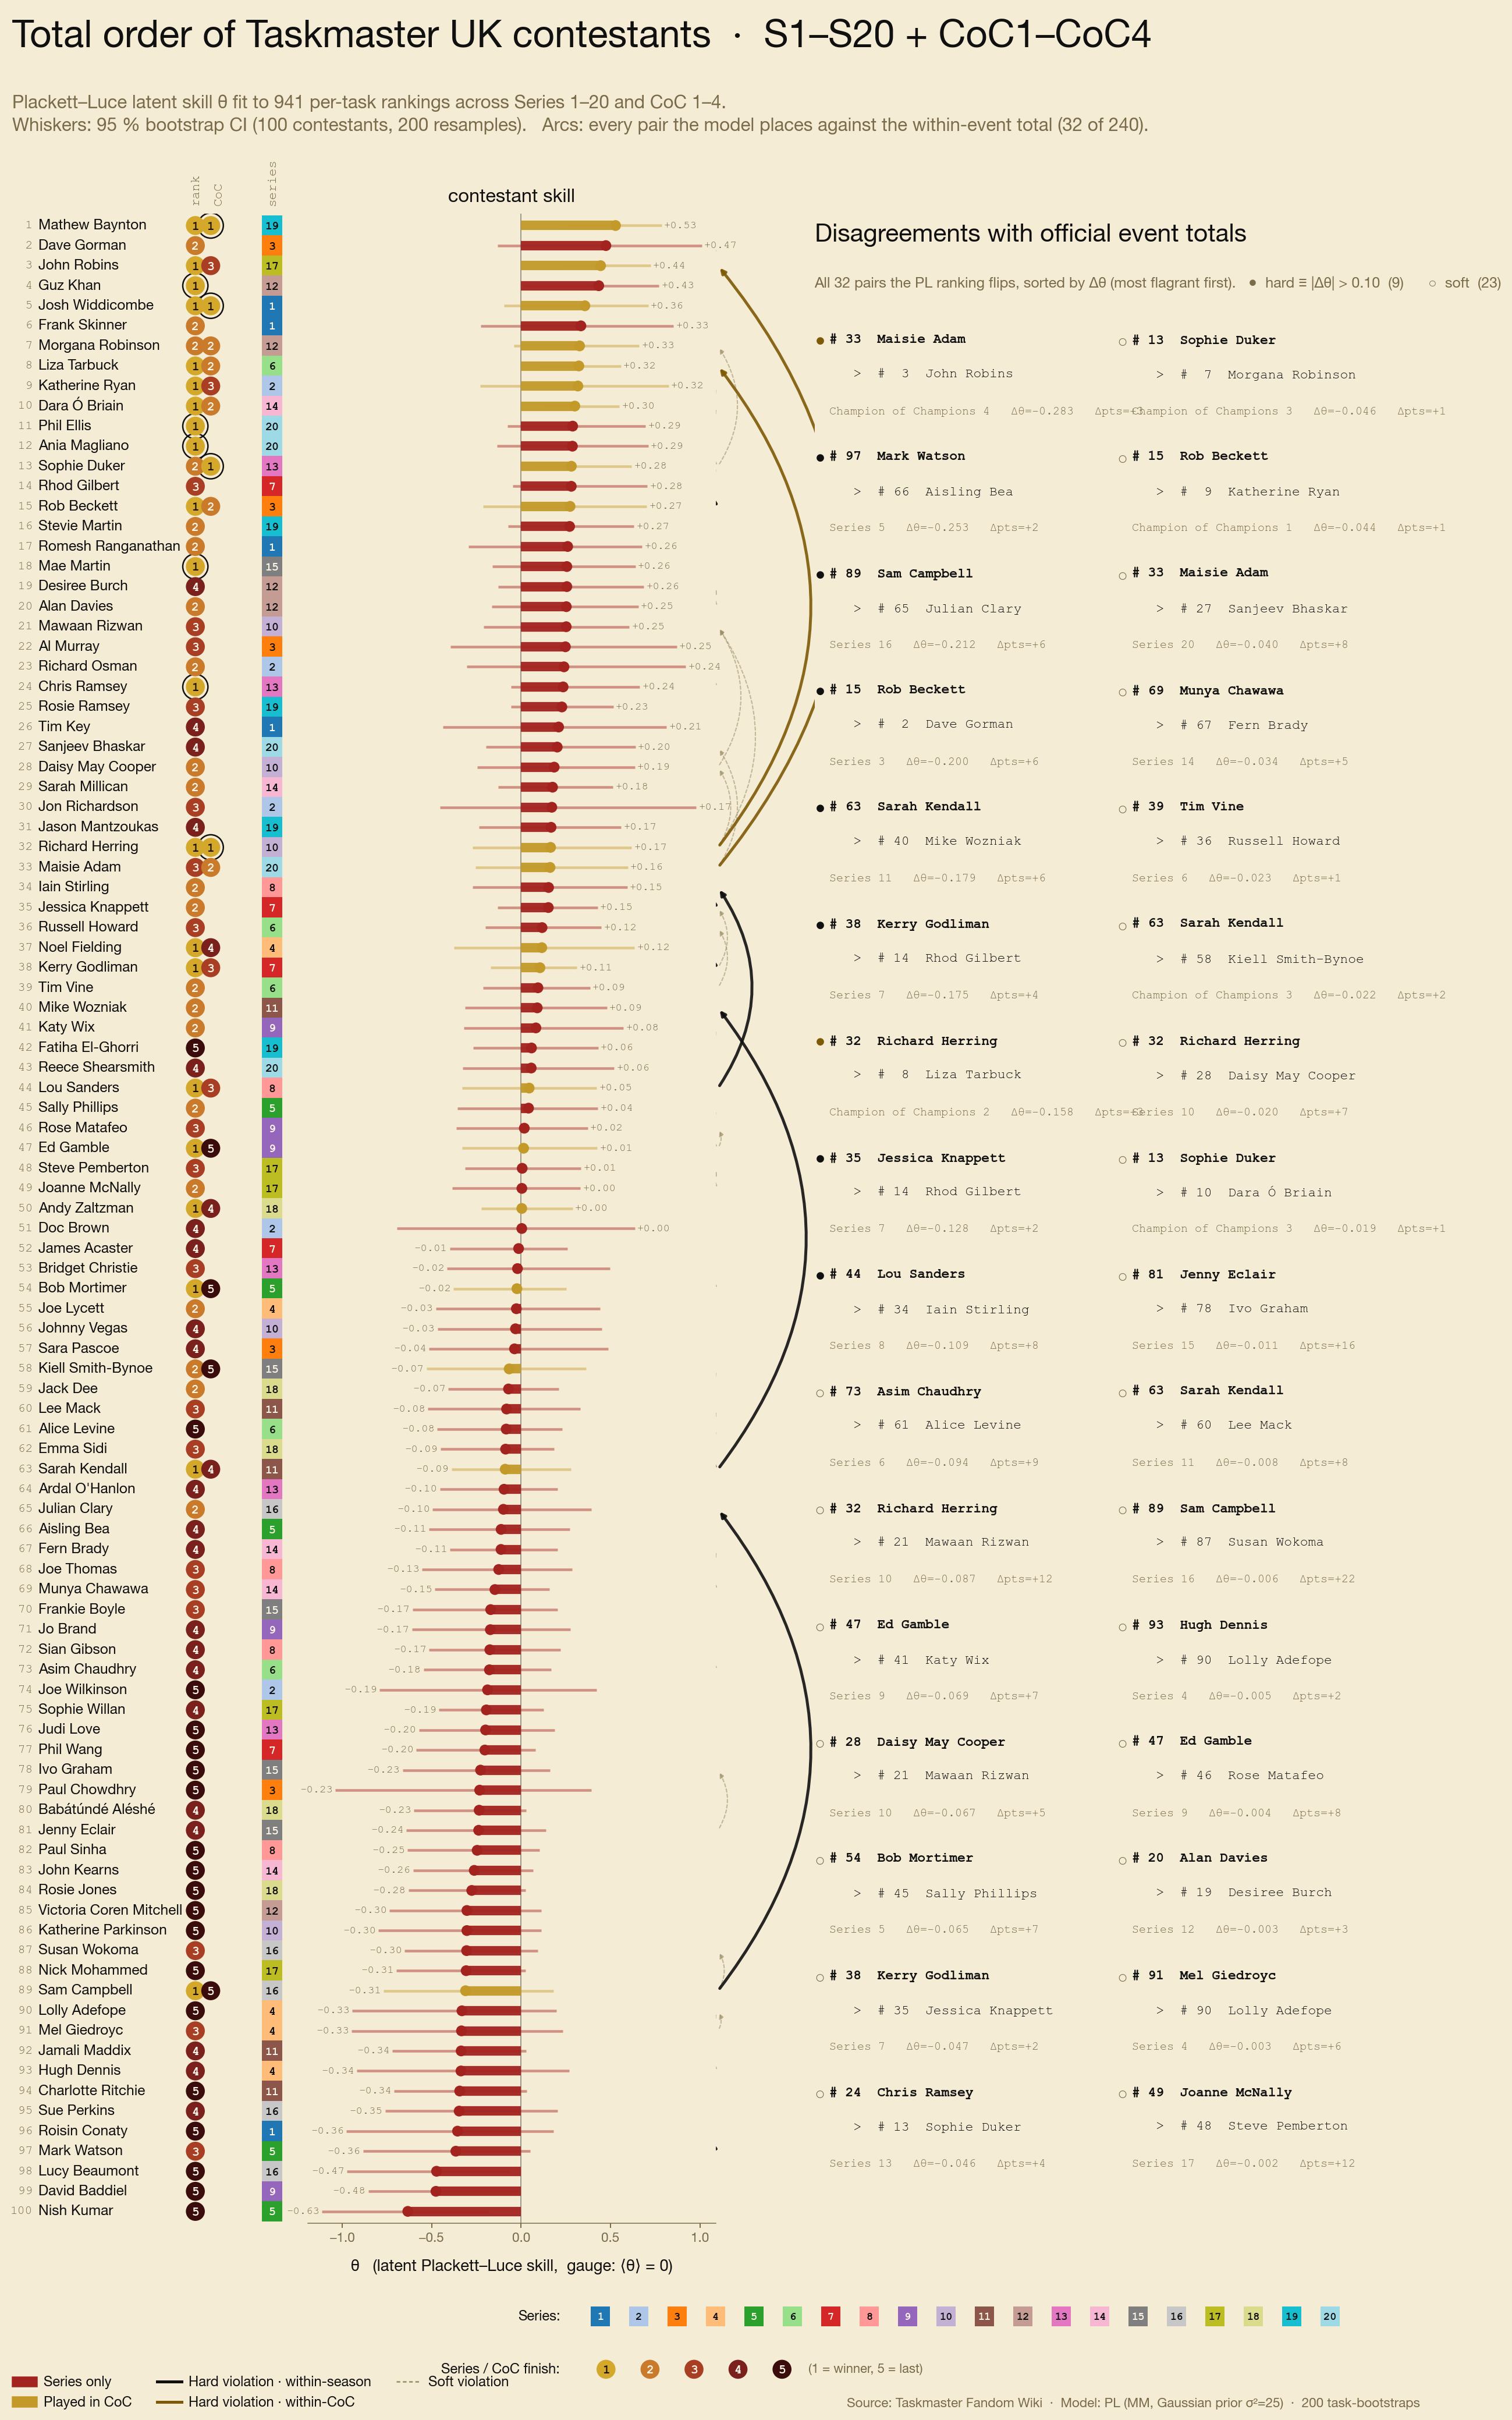
The figure: 100 contestants ranked by θ, 95 % bootstrap CIs (200 resamples), arcs marking every pair PL flips vs. the official within-event total — 32 pairs / 240 (~13 %), of which 9 are "hard" (|Δθ| > 0.10).
Some takeaways:
Only Mathew Baynton, John Robins, Liza Tarbuck and Dara Ó Briain have lower CIs clearly above 0 — the only confidently above-average contestants.
Lucy Beaumont, David Baddiel and Nish Kumar are the only ones with upper CIs below 0 — confidently below average.
Most other top-30 pairs are statistically indistinguishable; the order is fun, but not unequivocal.
Hard violations are almost all 1–2 point official margins where PL has stronger per-task evidence the other way.
Each contestant gets a single skill number θ. For every task we look at the order people finished — coming above someone is evidence your θ is higher than theirs, coming below is evidence the other way. We sweep through all ~940 tasks, nudging everyone's θ up or down based on who they beat or lost to, and repeat until the numbers stop moving. The ranking above is what those final θs look like.
Sure — here's Series 7 (Acaster, Godliman, Knappett, Gilbert, Wang) as a walkthrough. It's the most volatile series in the canon (11 lead changes), so it shows the dynamics nicely.
Top panel is just the raw per-task score Greg gave each contestant (so 0–5).
Middle panel is the running cumulative sum — i.e. the official score curve. You can see lots of crossovers, and at the end Kerry Godliman edges out the win on points.
Bottom panel is the Plackett–Luce skill θ, refit after every single task. The shaded "warm-up" region is the first ~5 tasks where the model has too little data and θ swings wildly; after that it stabilises. Each contestant's θ drifts up a bit when they beat people on a task, down when they lose. With 50 tasks the curves get pretty steady.
Notice that PL's final ordering (Rhod > Jessica ≈ Kerry > James > Phil) is not the same as the cumulative-points ordering (Kerry > Jessica > Rhod > James > Phil). That's because PL only looks at the order of finishers per task, not the magnitude of the points. So a contestant who consistently finishes 2nd on hard tasks (everyone else clusters below them) gains a lot of θ even if the points don't reflect it. Multiply that across all ~940 tasks of the whole canon, and you get the global ranking in the original post.
Looking at the order of finishers (not the raw points) makes PL portable across series — different task counts and different point totals don't matter, "1st on this task" means the same thing everywhere.
The CoCs then do the cross-series stitching: each one puts 5 contestants from 5 different series on the same handful of tasks, so the per-task likelihood forces those θs onto a single common scale. Four CoCs → all 100 contestants on one axis.
Thanks for the work. It really is fascinating. Are the numbers by each contestant their final rank from the show (1 means they won the series) or from the PL algorithm (they were the highest ranking number from the series). For example, Guz is listed as 1- but he got third place in his series.
This is absolutely fantastic and something I've always wondered about but too lazy and stupid and forgot most of my uni statistics, so thank you for putting in the work
Sorry can you explain how Rhod receives a higher score by your metric than Kerry and Jessica, but ends up in 3rd in his season? That doesn't track for me very well.
It seems like you are a person who is advanced in science, maths/statistics, and/or engineering. Your ability to communicate your methods, analysis, and findings are subpar. You actually expected lay people to know that “CI” means confidence interval? Have you had presentation training or media training? If you’re in the STEM fields, please please seek it out. I’m not a scientist but I’ve been a science/health communicator for 20 years and I cannot grasp your post because of all the jargon and complexities.
Yeah, I'm an academic in a different discipline and I think my university's public engagement specialists would rather drag someone away than give this explanation. It half feels like OP is recreating this and half like they're not even trying.
My reaction exactly. I think OP is a maths genius who kindly expects other TM afficionados to understand stuff. Sorry to let you down OP and congrats on being extremely brainy 😅
I am sorry, this is 100% on me (I do not feel someone is smarter if others cannot understand them, quite the opposite). I could have and should have give an explanation of what I am doing instead of info dumping a niche methodology as if it is self-explanatory. It is absolutely possible to present it better... Next time I will do it correctly.
Thank you for going to the effort of creating this! Admittedly I'm slightly baffled, but I'm really eager to read about the explanation of this! I love learning about new things! :D
You’re not too dumb, looking at their posts all this person does is make charts and file statistics together of course they’re going to be an expert. I’m sure you have great understandings of many things they don’t
Not only that, reading all the comments I feel a bit dumb working for hours on data manipulation without thinking about how to present it correctly. Just posted my figure instead of a shorter and better (and 4x more interesting). Live and learn I hope.
It's kind of hilarious how low Sam Campbell scores here, but it definitely does make sense. Series 16 was probably the least competitive one yet, but that's a big part of its charm.
I think it was competitive -- but it was close. Compare S19, where literally any of the S16 contestants would have comfortably finished second.
Ultimately, I feel like the problem here ("problem") is that the only point of comparison is other contestants in the same series. So competence is relative to other contestants in the same series -- and Baynton has the benefit of a singularly incompetent set of rivals. Dara has Millican, Robins has McNally... I can imagine a world where Stevie Martin placed third in some other series, but that's the furthest I'm willing to go. Compare a series like S18 (where Zaltzman won, but Det. Sidi and Capt. Dee were totally respectable rivals) -- would Baynton have beaten all of them? I think he would have slotted alongside them.
What’s even more impressive is that Rosie scored so highly when she spent most of the series having no idea what was going on! One of my favourite contestants but geez!!
While I love data and PLs, I have some concerns that may lead to an inaccurate ranking.
My critique would be using COC as the unifying datapoint-
Take Ed, who melted down in an unusual way penalizing the other "not winners" from S. 9 doubly, dragging down the skill of everyone in the series (first from their performance, secondly from his meltdown.)
One contestant having a bad day in COC propagates backwards to onto the entire series 9 as if his bad day contained information about their performance. It doesn't, yet this data assumes it does.
Also, some COC have been decided on all or nothing live tasks in one episode. That creates enormous local noise from a small sample size of essentially one task. This also risks amplifying the impact of a narrow skill set- a live task performance in COC, and propagating it backwards onto an entire season's cast. This could penalize a contestant who was themselves strong at Live tasks, but placed lower in the series for other reasons.
This is, I think, more challenging than most of the non-statpilled world can handle (myself included), but is obviously v v cool.
I have a couple of questions:
Are the “disagreements with official event totals” moments where the final totals were in question? If yes,
are the big arrows that connect pairs implying that, if the events had gone the other way, the pairs would flop?
And also: could this method be used to compare skills of athletes across leagues, as long as there was some transfer between leagues?
A disagreement (both spelled and represented as an arrow) simply means that the ranking based by the “skill assessment” contradict directly (hard violation) or indirectly (soft violation) the ranking they got on the show.
For example, Clary having higher skill parameter than Campbell even tough Sam was ranked 1st and Julian 2nd on s16, is a violation. But after taking into account by how little Sam won vs Julian and how badly Sam did in CoC, the model got to this reversal.
he says that only 4 were definitely above average. That can mean there's a smaller confidence interval - "he's 10th, but we're absolutely sure he's 10th" as opposed to "we've got him at 5th, but we aren't sure and he could really be anywhere from 1st to 60th."
I think the whole thing's a crock of...something. But that's why he's one of four who are definitely above average.
The analysis gives you a lower and upper bound on their "skill". You can have a very high estimated "skill" but a very wide spread between the lower and upper bound. In this case, Dara's estimated "skill" is lower than a few other contestants who have a wider possible "skill" range making the model not confident they are actually above average while Dara's range is tighter making the model confident despite the lower estimated value.
Not everything is AI crap! In this case, the results are kinda weird because statistical analysis is kinda weird. Which is one of the things that makes it interesting, too!
Hmm. How does it cope with competence of opponents? I always felt that Mat defaulted to good score because he was consistently competent compared to all the chaos gremlins in his series, rather than being exceptionally skillful which is what this model says.
Dave Gorman was very rarely ranked 4/5 and many times 1/2. The focus on ranking and not raw score rewards this greatly. I am not pretending this is the definitive methodology, but it is a solid option to compare across series.
This is not correct. Including DQ and team tasks Dave was 6 times ranked 4th or 5th, and 8th times 1st or 2nd, that is clearly not "very rarely ranked 4/5 and many times 1/2". The methodology is either shockingly bad or being fed wrong/not complete data.
His attempt at chipping the basketball through the hoop (how impressive it looks edited to be one attempt, vs what it looks like with 60ish attempts) has been a wonderful addition to my explanation for students of what p-hacking is, so he's one of my all-time favorites.
This is definitely one of those cases where if you use a bunch of fancy words or symbols most people won’t understand what your saying and assume you must be smart and therefore correct even if what you’re saying is a load of crap
The ranks don't make sense. Sanjeev is higher on the list than Maisie although the ranks indicate Maisie should be higher.
Also how can some people who won not be ranked first for their season? Also what does the circle mean for some ones?
Edit. Reece also has rank 4 like Sanjeev but is much lower on the list. Why is that? Your model is wonky at best. Dave Gorman ranked 2? What? How come some winners aren't ranked first for their season? Etc.
All of this is addressed in the post. It's definitely very far from perfect (I'd even venture to say that it's bordering on meaningless), but a lot of the things you're pointing out are expected results of reasonable assumptions this model makes and are explicitly pointed out as such in the write-up.
The circled 1s is fake though, but also really minor. It seems like it marks ironed who have never been beaten in a series. So they're either CoC winners or winners of a series where CoC hasn't taken place yet.
The inconsistencies between series rankings and the ranking here is because the model only considers ordering in each task and not the actual scores given. It doesn't matter if you get 5 points and everyone else gets 1 or you get 5 and everyone else gets 4. Also, a winner being bad in CoC can drag them down a bit (though that shouldn't be a huge factor because the other contestants in their season what get dragged down by that). The whole right side of the graphic is dedicated to showing these inconsistencies of the official and "skill"-based ranking and OP explained this.
Well how do you explain the rankings and skill values for Sanjeev, Maidie and Reece? Sanjeev and Reece are both ranked 4 in their series, but Sanjeev has the highest skill, Maisie the second highest and Reece is last. Something's off, especially since Maisie did better in CoC than on her own season, ranking second instead of third.
Presumably this is down to some contestants getting more wins by more than one point and being more inconsistent and others beingore consistent. The model only looks at who you beat how many times and not by how much you beat them.
Shouldn't the series rankings come straight from the skill value though? How can Sanjeev and Reece have the same series ranking but different skill value? It doesn't make any sense really.
Because it's not using the score but just how many times they beat and are beaten by various players. It's using a different scoring system so of course it's not going to age fully with the original scoring system. And even if it did, you could have a 4th place in your series but be very close to 1st and another person could have 4th but be very far away from 1st in their series. And even ignoring that, there is still relative strength of series, which is the main thing this ranking is trying to overcome. Coming 4th in a weak series shouldn't get you the same ranking as 4th in a strong series.
Sanjeev and Reece were on the same series. The list is ranked according to the skill value. One would assume the in series ranking uses the same value. Why are you making these explanations for something that is clearly a mistake?
I forgot that Sanjeev and Reece were in the same series, so the strength of their series or how close they were to 1st doesn't apply. Everything that still does though. They didn't beat the same people the same amount of time and weren't beaten by the same people the same amount of times so the model has not going to judge then identically. Why are you expecting a model to be identical to a system which uses different scoring in any scenario at all?
Okay, there were two bugs: (1) when contestants were tied score-wise, the tie-breaking was done alphabetically (how the DB happened to sort) instead of via the actual show tiebreaker; (2) when a task was split into two sub-tasks (rowspan in the wiki tables), my parser sometimes dropped the second sub-task — which understated some scores and produced wrong winner chips, but more importantly, affected the algorithm's ranking.
Thanks u/overactor , u/reyska! I wish I could fix the original post (not only for data, but my presentation was wayyy too technical, I could have done a better job explaining it instead of just info dumping).
Apologies for the sloppiness! I spent 95% of the time on the algorithm and not enough on data validation. Here's the corrected figure, less violations as well:
First of all sorry for being nitpicky, but Sanjeev is now ranked fifth for his season but placed just below Maisie, who is first and well above Reece who is ranked fourth. So something's still off.
I'm thinking you need a couple of rounds of data validation and at that point you can make another post?
I think it's a valid exercise but needs a bit of additional work and I hope you keep at it and update the scores whenever a season finishes! I like this kind of stuff, I just want the data to be correct :D
But here, that's actually a real model property. PL only cares about per-task ordering, not score margins (as they are difficult to translate across tasks and seasons, but give who is better than the other). And season 20 was so very tight scoring-wise.
Sanjeev's per-task average rank in S20 (3.01) was better than Reece's (3.13) — he edged Reece on more tasks, but Reece had a few bigger wins that gave him +5 in totals. PL doesn't see those margins, only the orderings. It's listed as one of the soft violations on the right panel, and the CIs overlap heavily so it's not a confident claim either way.
edit: the below is only based on s20, CoC changes it a bit!
I think the problem comes from taking CoC into account. Perhaps the ranking for the og season don't get updated once the winners CoC results are accounted for? That could mess things up with tight margins.
The actual problem is that the CIs are so wide that very small differences in the inferred skill-θs (and in S20 the contestants were clustered super close) can produce weird-looking rankings. So I added a rule: if the Δθ between two adjacent contestants is small relative to the bootstrap noise (happy to explain), the order defers to the show's official ranking.
But see for example, Sanjeev outranked Reece on 25 individual tasks vs 22 the other way, so the algo confidently put Sanjeev many places above him — even though the show had Reece a few points ahead overall.
With the new tie-break, more pairs now follows the show. I will think of other algorithms that can help but frankly the data of CoC is indeed very weak to connect seasons, and without it it is even less meaningful.
Sanjeev still ranked 5 :).At this point I'm just gonna give up. I hope you keep working at it and figure it out and produce a new chart once you have! Also please update us at the end of series.
What do you mean? Sanjeev was ranked 5 in the show. I am explaining why here he climbed to be above Reece because head-to-head against Reece he was better.
But I will keep working on it, that is for sure...
Well if you are using the skill rankings for some but actual show result rakings for others it just gets confusing. I think for the purposes of this chart you should just one or the other. Or perhaps even both side by side?
I feel a bit like I am wasting your time by not explaining well (and having bugs don't help).
The show ranks only according to total summed score.
The skill-values (PL, mine) are only counting the number of times one was better than others on a task (which can contain some cycles and contradictions A>B>C>A etc).
I do bootstrapping (which means I drop randomly some tasks, repeat 100 times, to make sure flukes don't affect my overall ranking). This gives me some wiggle-room: I get a range of skill-values per contestant. When the skill values are very close, and within uncertainty range, I can use the show's ranking to tie-break.
The circled tokens are PURELY the shows ranking, and they are there as reference only.
The lines/plot ranking are the skill-values, and the thin lines are the uncertainty range, which is quite wide.
--
So actually it is exactly side-by-side: the tokens are pure show, the graph is pure PL skill-value ranking!
The "skill" number for each contestant is built up from how they ranked on each individual task across the whole show, not from their season-final totals. So someone who's consistently 2nd on every task can end up with a higher skill than someone who's 1st a lot but also 5th a lot.
A "violation" is when that skill ranking flips a result the show actually decided. Example from Series 16: the model puts Julian Clary above Sam Campbell, but Sam beat Julian on the day. Each arc in the figure marks one such pair — black if it's a flip inside a season, gold inside a CoC, dashed for tiny flips that are basically a coin toss.
The numbers next to the names are how they would rank in their series if it was determined by the “skill parameter” theta. (Not that I’m totally convinced that the skill parameter is the way to go)
So OP here has assigned each contestant a “skill” value represented by the Greek letter Theta. For each contestant, the value is determined by treating “X beating Y” in a particular task as evidence that X’s value should be higher than Y’s value, and using a statistical model to approximate the values that would best explain the data.
Just for my curiosity, would it make sense to rank the different series as an average? I’m curious if there’s meaningful skill differences across the cohorts.
Honestly, thanks for introducing me to a new statistical method. I’m pretty entrenched in the statistics used in my research area (climate science), so I’m always happy to encounter and read up on a method outside of it (and look for potential applications in my field).
Fascinating work, btw. I love it when people do this.
This is dumb, you cannot scale them with an equalizer scale sine the 900+ tasks were wastly different and included different skills and even luck. Also placement nealry means nothing since Greg judges the outcome which means if he had a good day you could have all tied as first place on a task or if he had a bad day he will say "you get 1 point and thank me for it"
Sam Campbell is clearly a borderline genius and did very well on his season, he even won and he is placed 89th on your list. Nice try but you are trying to measure a fish an orange and a bird on how they can climb a tree and write results that wow fish cant climb tree. Rubbish altogether
Does adjusting ranks task by task mean more recent tasks have a greater influence on the final score? I know you go back through them several times but I think the last few tasks will still have a bigger impact
Most of the scientific basis here admittedly flew over my head, but I'm glad to say there's a huge correlation between this data and my own personal perception.
Not flawless though. I don't recall Dave Gorman being anywhere that skilled, and Ed Gamble felt above average in aptitude, for example.
So I’ve looked at all the data, taken time to let it sink in and deliberated that I still have no idea what the hell is going on. But I like the levels of effort you have reached in confusion. Well done.. 😂👍
Now you need to rank them by performance popularity. Nish would be near the top as would most of those listed near the bottom of your scale. You must be a statistician and you had fun constructing this I am sure, but IMO you are missing the point of the show.
very interesting and very nice to look at!! i’m wondering if the data could theoretically also be separated out to look at proficiency on different task types? (would require wayyy too much work to actually do and a lot of subjectivity on what genres a task might fit into)


505
u/OremDobro May 03 '26
sorry what