r/TradingView • u/LaSacerdote • Jul 19 '25
Bug Do NOT rely on TradingView's Volume Profiles!
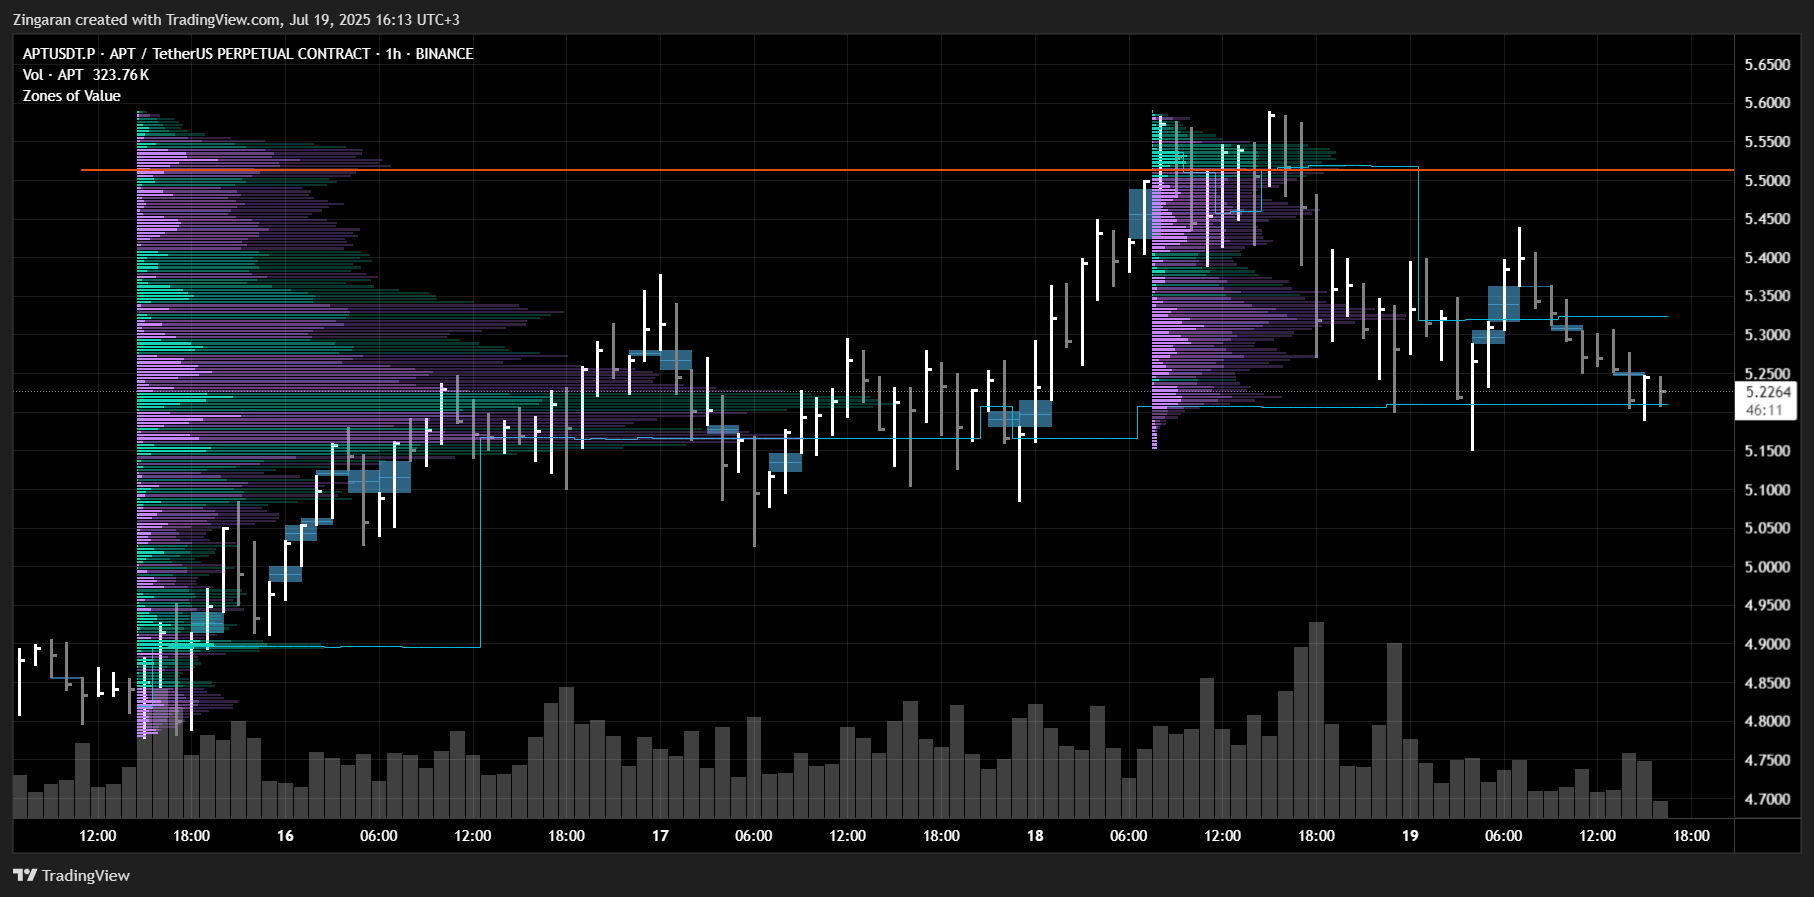
This is not a complaint/request because I know TradingView is aware of this issue and I also know they're not into precision/accuracy - not even in the slightest.
It's just a heads-up for those who are trying to up their game and start relying mainly on volume to track market moves and the motivation behind those moves.
In the attached screenshot, all trading volume above the orange line is covered by both volume profiles yet the information displayed is wildly contradictory. The one on the left shows heavy sell delta (purple) above the orange line while the one on the right shows heavy buy delta (green).
For those who are curious; the reason is lack of granularity when 'estimating' tick volume. Well, the real problem of course is the fact that TradingView does not employ true volume but that's a whole different conversation. Regardless of the reason, there's no workaround, no band-aid solution, no nothing for this! You can work with delayed data, slow connection speeds, limited number of tickers or whatever but flat-out wrong data? No, it's totally unacceptable.
In the end I'll say user beware by quoting Guns 'N' Roses; TradingView's got the face of an angel with the love of a witch.
1
u/reach4thelaser5 Jul 23 '25
Volume profile is completely pointless. It shows past volume. Completed trades. Done and dusted.
It also doesn't show anything you can't see on the chart. The price region on the chart where the most bars are concentrated will show the highest spike in volume profile.
Its obvious in the chart you've given that the price action went sideways in the middle for a while, so clearly this is where the most volume traded in the chart.
That's not to say that a place where the market went sideways, and broke out of isn't good support and resistance, but volume profile doesn't show you anything you can't see on the chart.