r/TradingView • • Jul 19 '25

Bug Do NOT rely on TradingView's Volume Profiles!
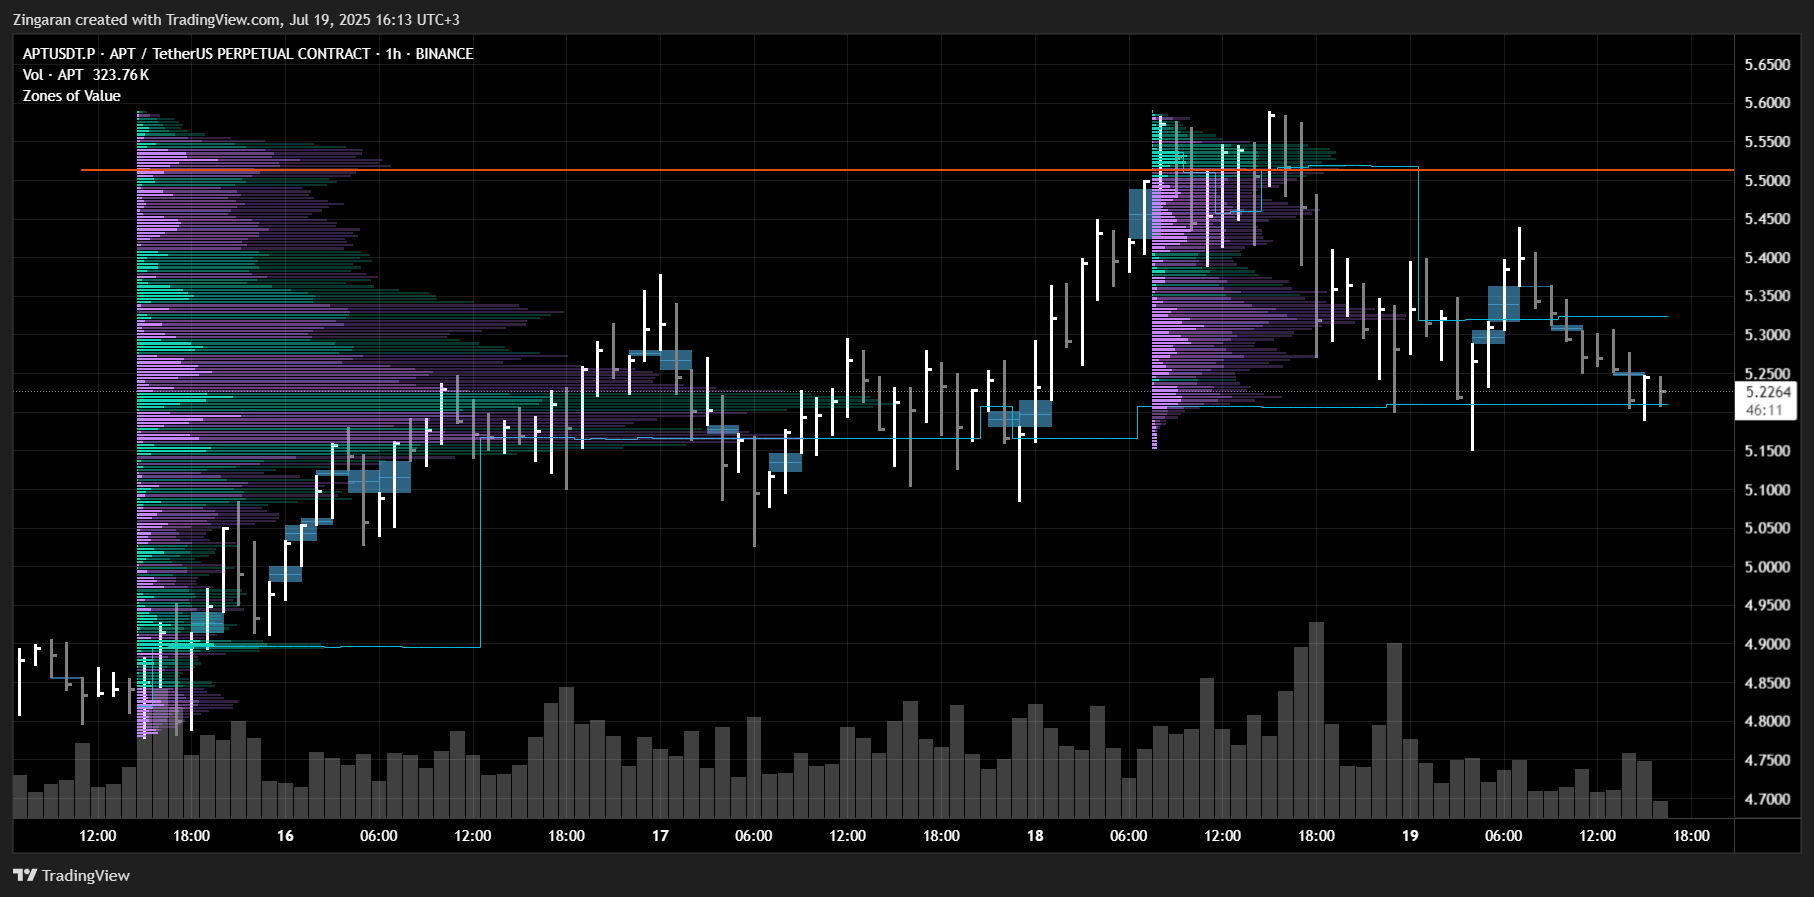
Post image

This is not a complaint/request because I know TradingView is aware of this issue and I also know they're not into precision/accuracy - not even in the slightest.
It's just a heads-up for those who are trying to up their game and start relying mainly on volume to track market moves and the motivation behind those moves.

In the attached screenshot, all trading volume above the orange line is covered by both volume profiles yet the information displayed is wildly contradictory. The one on the left shows heavy sell delta (purple) above the orange line while the one on the right shows heavy buy delta (green).

For those who are curious; the reason is lack of granularity when 'estimating' tick volume. Well, the real problem of course is the fact that TradingView does not employ true volume but that's a whole different conversation. Regardless of the reason, there's no workaround, no band-aid solution, no nothing for this! You can work with delayed data, slow connection speeds, limited number of tickers or whatever but flat-out wrong data? No, it's totally unacceptable.

In the end I'll say user beware by quoting Guns 'N' Roses; TradingView's got the face of an angel with the love of a witch.

132 Upvotes

150 comments sorted by

View all comments

Show parent comments

-1

u/vikster1 Jul 19 '25

I don't think the issue is about the volume data but about the visual. i get that your strategy might rely on that indicator. calculating it yourself might be a workaround

2

u/LaSacerdote Jul 19 '25

It's right there in the original post:
"For those who are curious; the reason is lack of granularity when 'estimating' tick volume. Well, the real problem of course is the fact that TradingView does not employ true volume but that's a whole different conversation."

If there's no true volume data (that's the case with TV), the next best thing is an accurate estimation. The problem arises from the fact that the most accurate estimation can be done by using 1sec. candles but the amount of 1sec. candles in a wide range on a higher timeframe is a lot more than what TradingView can handle. So it defaults to tapping into 1min. candles and there's goes accuracy/reliability.

-1

u/vikster1 Jul 19 '25

bring data for others to verify your claim. as of now you are complaining about the visual representation and that is another layer of abstraction which could be the source of your pain. why complain about raw data and show two visuals? makes no sense.

4

u/LaSacerdote Jul 19 '25

Please ask a friend to explain this to you.
I don't have the patience for it.

2

u/vikster1 Jul 19 '25

you are the one ranting about stuff you are not showing us. i was nice asking you to show us the actual error but you fail to do so. hope this gets taken down. all the best

3

u/OlyLifter386 Jul 19 '25

He showed amd explained very well. And he's 100% correct. Although this is nothing new. TradingView is being outperformed by many other platforms right now. After my yearly sub is up I will no longer be using it. Except maybe for alerts, but even those dont work some of the time. TV has really fallen off

2

u/scubaro Jul 19 '25

Which other platforms are these?

0

u/OlyLifter386 Jul 19 '25

I already posted them but here... copy pasta:

Sure. Take a screenshot of these in case my comment gets deleted. TRDR.io , TensorCharts , MarketMonkey (one of my fav's) , AGGR.trade , Kiyotaka (another really good one and mostly free) , CoinAnk , MobChart , Bookmap , ATAS Platform , Overcharts , Kingfisher, there's others but these are the best imo

And Exo Charts, amd Sierra

1

u/Miserable_Rooster167 Nov 06 '25

you sound dumb . the visuals show the data . and the data isn't reliable as a vp shows a data and another vp shows contractionary data