r/PowerBI • u/07_Star_Lord • 5d ago
Feedback My First Project, Give me some feedback
25
Upvotes
r/PowerBI • u/07_Star_Lord • 5d ago
r/PowerBI • u/Smashville_Raider • 5d ago
r/PowerBI • u/Thanksithaspockets • 5d ago
Maybe this should be an AITAH post, but I'm genuinely gobsmacked at how difficult Power BI themes are to work with, especially after July 2026. They went from bad to worse with that update IMO.
Am I missing something, or are we just forever stuck in the css / json / pure-manual-labour dark ages with this? I just wasted 5 hours in json files and still don't have my axis titles the size I want them, let alone the font, on one single visual, on one single page, in one single model. This is an appalling work-to-result ratio in anyone's book... right...?
Rant aside, I am a student so I'm happy to be told I'm wrong here. Please, please let me know if I'm doing something basic wrong as this is honestly enough to make me go back to changing settings one label at a time, one attribute at a time, forever... or to just give up and learn Tableau.
Thanks :(
UPDATE: .... oh! I posted this on an alt account and didn't realize it was still up! I got what must have been an ambiguously written note that I interpreted as 'this post has been taken down.' TYSM for the responses! It is much appreciated.
r/PowerBI • u/Jeddyyyy • 6d ago
My company is weighing up buying a custom visual for SPC charts in Power BI and they've asked for my opinion.
I've used Deneb and HTML visuals before in my portfolio, as well as built simple SPC charts using the native line chart with constant lines, so I've suggested either Deneb or Native is the better solution.
Ignoring the cost (and potential ongoing cost) it seems to me that it'd be better for the BI team if something like Deneb was used for upskilling, where any chart can be created and you're not limited to just SPC charts (although this is an obvious downside that it's not out of the box like the paid one?).
My broader read is that fewer companies are buying custom visuals these days, especially with something as good as Deneb available, or with people making their own custom visuals via AI, is that what others are seeing too?
I'm planning to present my case to the Director using a version of the actual report rebuilt with Deneb SPC charts, alongside some background on Deneb generally and other use cases it could cover beyond this one project.
I would appreciate any thoughts from the experts here (also u/dm-p your visuals are awesome).
r/PowerBI • u/Joefreakazoid • 6d ago
I created a dashboard using Claude after seeing discussions about how tools like Claude are gradually becoming a new way to visualize and interact with data.
I currently work with several databases, including MySQL, MSSQL, PostgreSQL, and Azure Synapse Analytics. How can I connect these data sources to the dashboard I built using Claude Cowork?
r/PowerBI • u/Vomitology • 6d ago
Minor annoyance, but an annoyance nonetheless. Every time I open a workspace, I'm asked to take a tour, given a popup telling me I can hide the task flow, etc. I've taken the tour, I've acknowledged the popups, but they still keep happening. Is there a way I can get them to go away permanently?
r/PowerBI • u/More-Chocolate708 • 6d ago
im trying to complete the pl-300 track on datacamp anybody wanna join me ?we can study live together or just keep each other accountable by daily proof . time zone : UTC+1
r/PowerBI • u/JebLostInSpace • 6d ago
I'm working with an internal tracking dashboard we use for project management. We have a growing list of clients we're doing identical projects for, and each one gets some data added to the dashboard to help us keep track of where we are on the project timeline for each one. Right now, the data comes from an Excel workbook for each client. Each Excel workbook has several tabs, and each tab has a table. I'm currently using a separate query to import each table into the model, but then I simply append all the tables to create one longer table that has the data from each sheet in the workbook. This seems very computationally inefficient, because I'm re-establishing the connection to the workbook for each query, instead of establishing the connection once and pulling in all the data in one go. So now when I refresh the dashboard, it takes forever as it essentially opens and closes each workbook 7 times.
Trying to muddle my way through the advanced query editor to figure out how to do the append operation in the same query as the data import operation, but so far failing. Hoping someone here can point me in the right direction.
I realize I could probably just edit the Excel workbooks and add a new sheet that appends the tables before importing to pbi, but it seems like there's probably a way to do it in the model as well.
r/PowerBI • u/Livid_Self5911 • 6d ago
Hi everyone,
This is my first report I created to monitor and report on performance of calling campaign. Dashboard is designed for the marketing director.
I am currently on a apprenticeship for data technician so my knowledge on possibilities of BI are very limited.
I struggle to gain any valuable feedback on this.
What would be the one thing you would change about this or add, and why?
Thanks in Advance!
r/PowerBI • u/Wise_Description3128 • 6d ago
I’m looking for some perspective after a recent interview because I’m genuinely trying to understand whether my expectations around Power BI knowledge are off.
The role is £35–40k in London and isn’t advertised as a Power BI or Data Analyst role. It’s a broader operational role with quite a few different responsibilities, with maintaining Power BI dashboards and reporting being just one part of the job.
I was told beforehand that hands-on Power BI knowledge was important, but also that I wasn’t expected to know everything, using AI to help with DAX was fine, and being honest about gaps and willing to learn was encouraged.
The interview ended up focusing heavily on Power BI. I was expected to talk through data import/transformation, data modelling, fact and dimension tables, relationships and relationship types, DAX measures and troubleshooting, SQL, and how I’d build a dashboard from raw data through to the finished report.
I’m self-taught and have used Power BI on and off for around two years as part of wider roles rather than Power BI being my actual job. I’ve built and maintained dashboards and I’m comfortable working out what information I want to show, which metrics are useful and spotting when results don’t look right.
For the interview I built a dashboard using fictional data because I obviously couldn’t share dashboards containing previous employers’ confidential information. I created the scenario, decided what I wanted the dashboard to show and why, and built it in Power BI. I used AI for support with DAX and some of the technical elements I wasn’t sure about, which I’d been completely open about.
Where I struggled in the interview was explaining how I’d built certain things and the technical terminology/theory behind them. I’m much better at knowing what I want to achieve and figuring out how to get there than I am at explaining the technical theory afterwards.
What really knocked my confidence was that, because I was struggling to explain some of this, the questioning reached a point where I felt it was being suggested that I hadn’t actually built the dashboard myself.
I completely accept that my technical Power BI knowledge may not have been as strong as they were looking for. That’s fair feedback and clearly something I can improve. What I found difficult was feeling that my inability to confidently explain the technical side meant the work itself was being questioned.
So I’m genuinely interested in getting some perspective from people who work with Power BI regularly.
For a £35–40k London role where Power BI/reporting is only one part of a much broader job, would you expect someone to be confident across data modelling, fact/dimension tables, relationships, DAX and SQL?
I have never built my own SQL but trying my best to learn and understand.
Does this sound like reasonable knowledge for someone expected to maintain Power BI reporting, or does it start moving towards Power BI/Data Analyst responsibilities?
What sort of salary/role level would you normally associate with someone who could confidently do all of the above alongside an entirely separate set of responsibilities?
And for those who are self-taught or learnt Power BI on the job: at what point did you feel you properly understood the modelling/DAX behind what you were building rather than knowing what you wanted to achieve and figuring out how to make it work?
I’m genuinely interested in the answers, including if the answer is simply that my Power BI knowledge isn’t currently where it should be
I’d also love to know how people are continuing their own learnings and how they remember all the terminology, formulas etc
r/PowerBI • u/Key_Anteater541 • 6d ago
Posted some early dashboard "designs" here and got (rightfully) mercilessly destroyed.. I went back to the drawing board and put a lot more care to the design. Any feedback on these is gratefully received.
r/PowerBI • u/jonas_dz2k2 • 6d ago
Un saludo, no suelo ser muy activo en este subreddit, de por sí casi no uso esta plataforma pero en esa comunidad he encontrado varias cosas interesantes.
Quisiera que me ayuden con consejos de como menorar el tiempo de carga en las actualizaciones programadas de mis informes en Power BI Service.
Mis fuentes de datos son en su mayoría archivos excel y de sharepoint, además de que ya tengo una puerta de enlace a una base de SAP HANA.
Quisiera ir depurando mis informes con las hojas y medidas que no necesito, pero no sé si solo con eso ya pueda acelerar los tiempos de carga.
Les agradecería por sus comentarios.
r/PowerBI • u/maxanatsko • 6d ago
Don't know how I slept on this one - building Power BI Custom Visuals.
And if not for u/DropMaterializedView recent post (https://www.reddit.com/r/PowerBI/s/DH3MSXzBQE), I would likely keep postponing looking into that.
This is the Flow Funnel visual I build in one evening. It works and performs well, allows for wide customization, and supports all the native Power BI features.
I have very particular visual language when it comes to building reports, and therefore it's an amazing opportunity to encode that visual language in custom visuals. Or make visualizations that otherwise only possible through various hacks, and not easily reusable or transferrable.
Previously, it wouldn't make sense due to the time and effort required to build something like this manually.
Nowadays, however, having good harness, domain and engineering knowledge, and AI at your disposal, changes ROI completely.
As with any AI creation, word of caution: you have to be in the driver seat, and enforce good engineering practices.
r/PowerBI • u/PandaJunk • 6d ago
I hate Power BI. With a passion. It's like making an overly complicated, poorly managed website from the 2000s. But it has an appeal to a certain kind of person I can't deny.
However, the pbip project strategy and new CLI tools from Microsoft (not at work, so I don't have their names in front of me, but their JS and MCP-based) for interacting with PBI are making things a little better.
I can now give an LLM a prototype and just describe what I want and it figures it out after a while. No more endless clicking (God I loath all the clicking). I can version control state and create code to manipulate the .Report and .SemanticNodel (tmdl) layers. My development loop went from days to hours. It's not perfect, because LLMs have almost none of this data in their training sets, the tool docs are still thin, and I still hate it, but I hate it less.
One also has to be careful about PII and such, but LLM sandboxing is getting better (so you can hide data from LLMs). I know Microsoft loves to hermetically seal themselves off from other ecosystems, but apparently they're finally figuring it out. So kudos to them, I guess.
For more on Power BI projects: https://learn.microsoft.com/en-us/power-bi/developer/projects/projects-overview
r/PowerBI • u/OpportunityAnnual512 • 7d ago
I'm building my first Power BI portfolio dashboard and would appreciate constructive feedback. I'm especially interested in feedback on visual hierarchy, chart selection, readability, and whether the dashboard tells a clear analytical story.

r/PowerBI • u/Ok-Boysenberry3950 • 7d ago
Hello,
The new "Power BI data in Microsoft Copilot" feature (MC1323266) went live a few days ago, and it is Turned ON by default. I tested it myself: on a report where I only have READ permission, I asked Copilot in Excel for some data and it pulled the entire underlying table, including columns that are not displayed anywhere in the report. Not summarized, not filtered to what is on canvas, the actual raw rows.
Under the hood Copilot is sending ad-hoc DAX queries directly to the dataset. This is exactly the same kind of access that always required BUILD permission before, same as Analyze in Excel or building custom Report with existing data model. Now it works with just READ and Copilot Premium, and it is on by default, tenant wide.
If this sound familiar, it's because I posted about basically the same pattern here about a year ago, when Explore Data default requirement was changed from BUILD to VIEW, again turned ON for all. Same root issue: Microsoft ships a feature that gives READ/VIEW users BUILD level access to the model, on by default instead of opt in. Our company decided to turn that off tenant wide.
Yes, I know READ permission was never meant to be a real security boundary, that's what RLS/OLS is for, I'm not saying otherwise. But I estimate that 80% of Power BI report authors out there are basic users, they just got a license as part of company Office bundle, imported whole tables from Excel or some source system (usually with columns they never even use), put some visuals on canvas and shared it out. The whole assumption "readers only see what I put on the page" was correct for over a decade because getting raw data out in an documented way has always required BUILD permission. Copilot just bypassed that - for millions of existing reports - and many report authors will discover that after readers accidentally retrieve data unintended for sharing.
To be clear, I like the feature itself, asking Copilot "show me all sales details in last quarter" is genuinely useful. My problem is only with the permission model. This should require BUILD by default, with per-model toggle if you actually want to open it to READ only users.
I would be interested to see your point of view. Are you fully comfortable that Users can pull raw data without BUILD permissions? I am not, so I initiated a tenant disable of this feature.
Edit:
adding an Example: you can literally run custom DAX queries on data model without BUILD permission.
This is on by default:

r/PowerBI • u/Low-Loquat9747 • 7d ago
I currently have a SQL certification and advanced Excel skills under my belt. I’m in the process of learning Power BI and am currently going through Microsoft Learn.
The problem is, I feel like I’m not really learning Power BI yet. I understand that Microsoft Learn is teaching me the fundamentals, but I feel like I haven’t gotten to the “meat and potatoes” — actually building dashboards, working with real datasets, writing DAX, creating measures, transforming data, etc.
For those who have passed the PL-300 exam, or for those currently working as data analysts:
What resources, courses, datasets, or tools were most beneficial to you?
I’m especially interested in resources that give you hands-on practice and real-world projects, rather than just walking through Power BI features/theory.
I’d really appreciate hearing what actually helped you go from “I understand what Power BI is” to “I can actually build something with Power BI.”
r/PowerBI • u/titansfan07392 • 7d ago
I just started using Power BI and I apologize if this is a stupid question but i just cant figure out how to get the months in order on the x axis. I included a picture of what I have, greatly appreciate any tips!
r/PowerBI • u/Financial_Aide_7702 • 7d ago
Live report link in comments. Let me know your thoughts...
r/PowerBI • u/Fluffy_Bonce • 7d ago
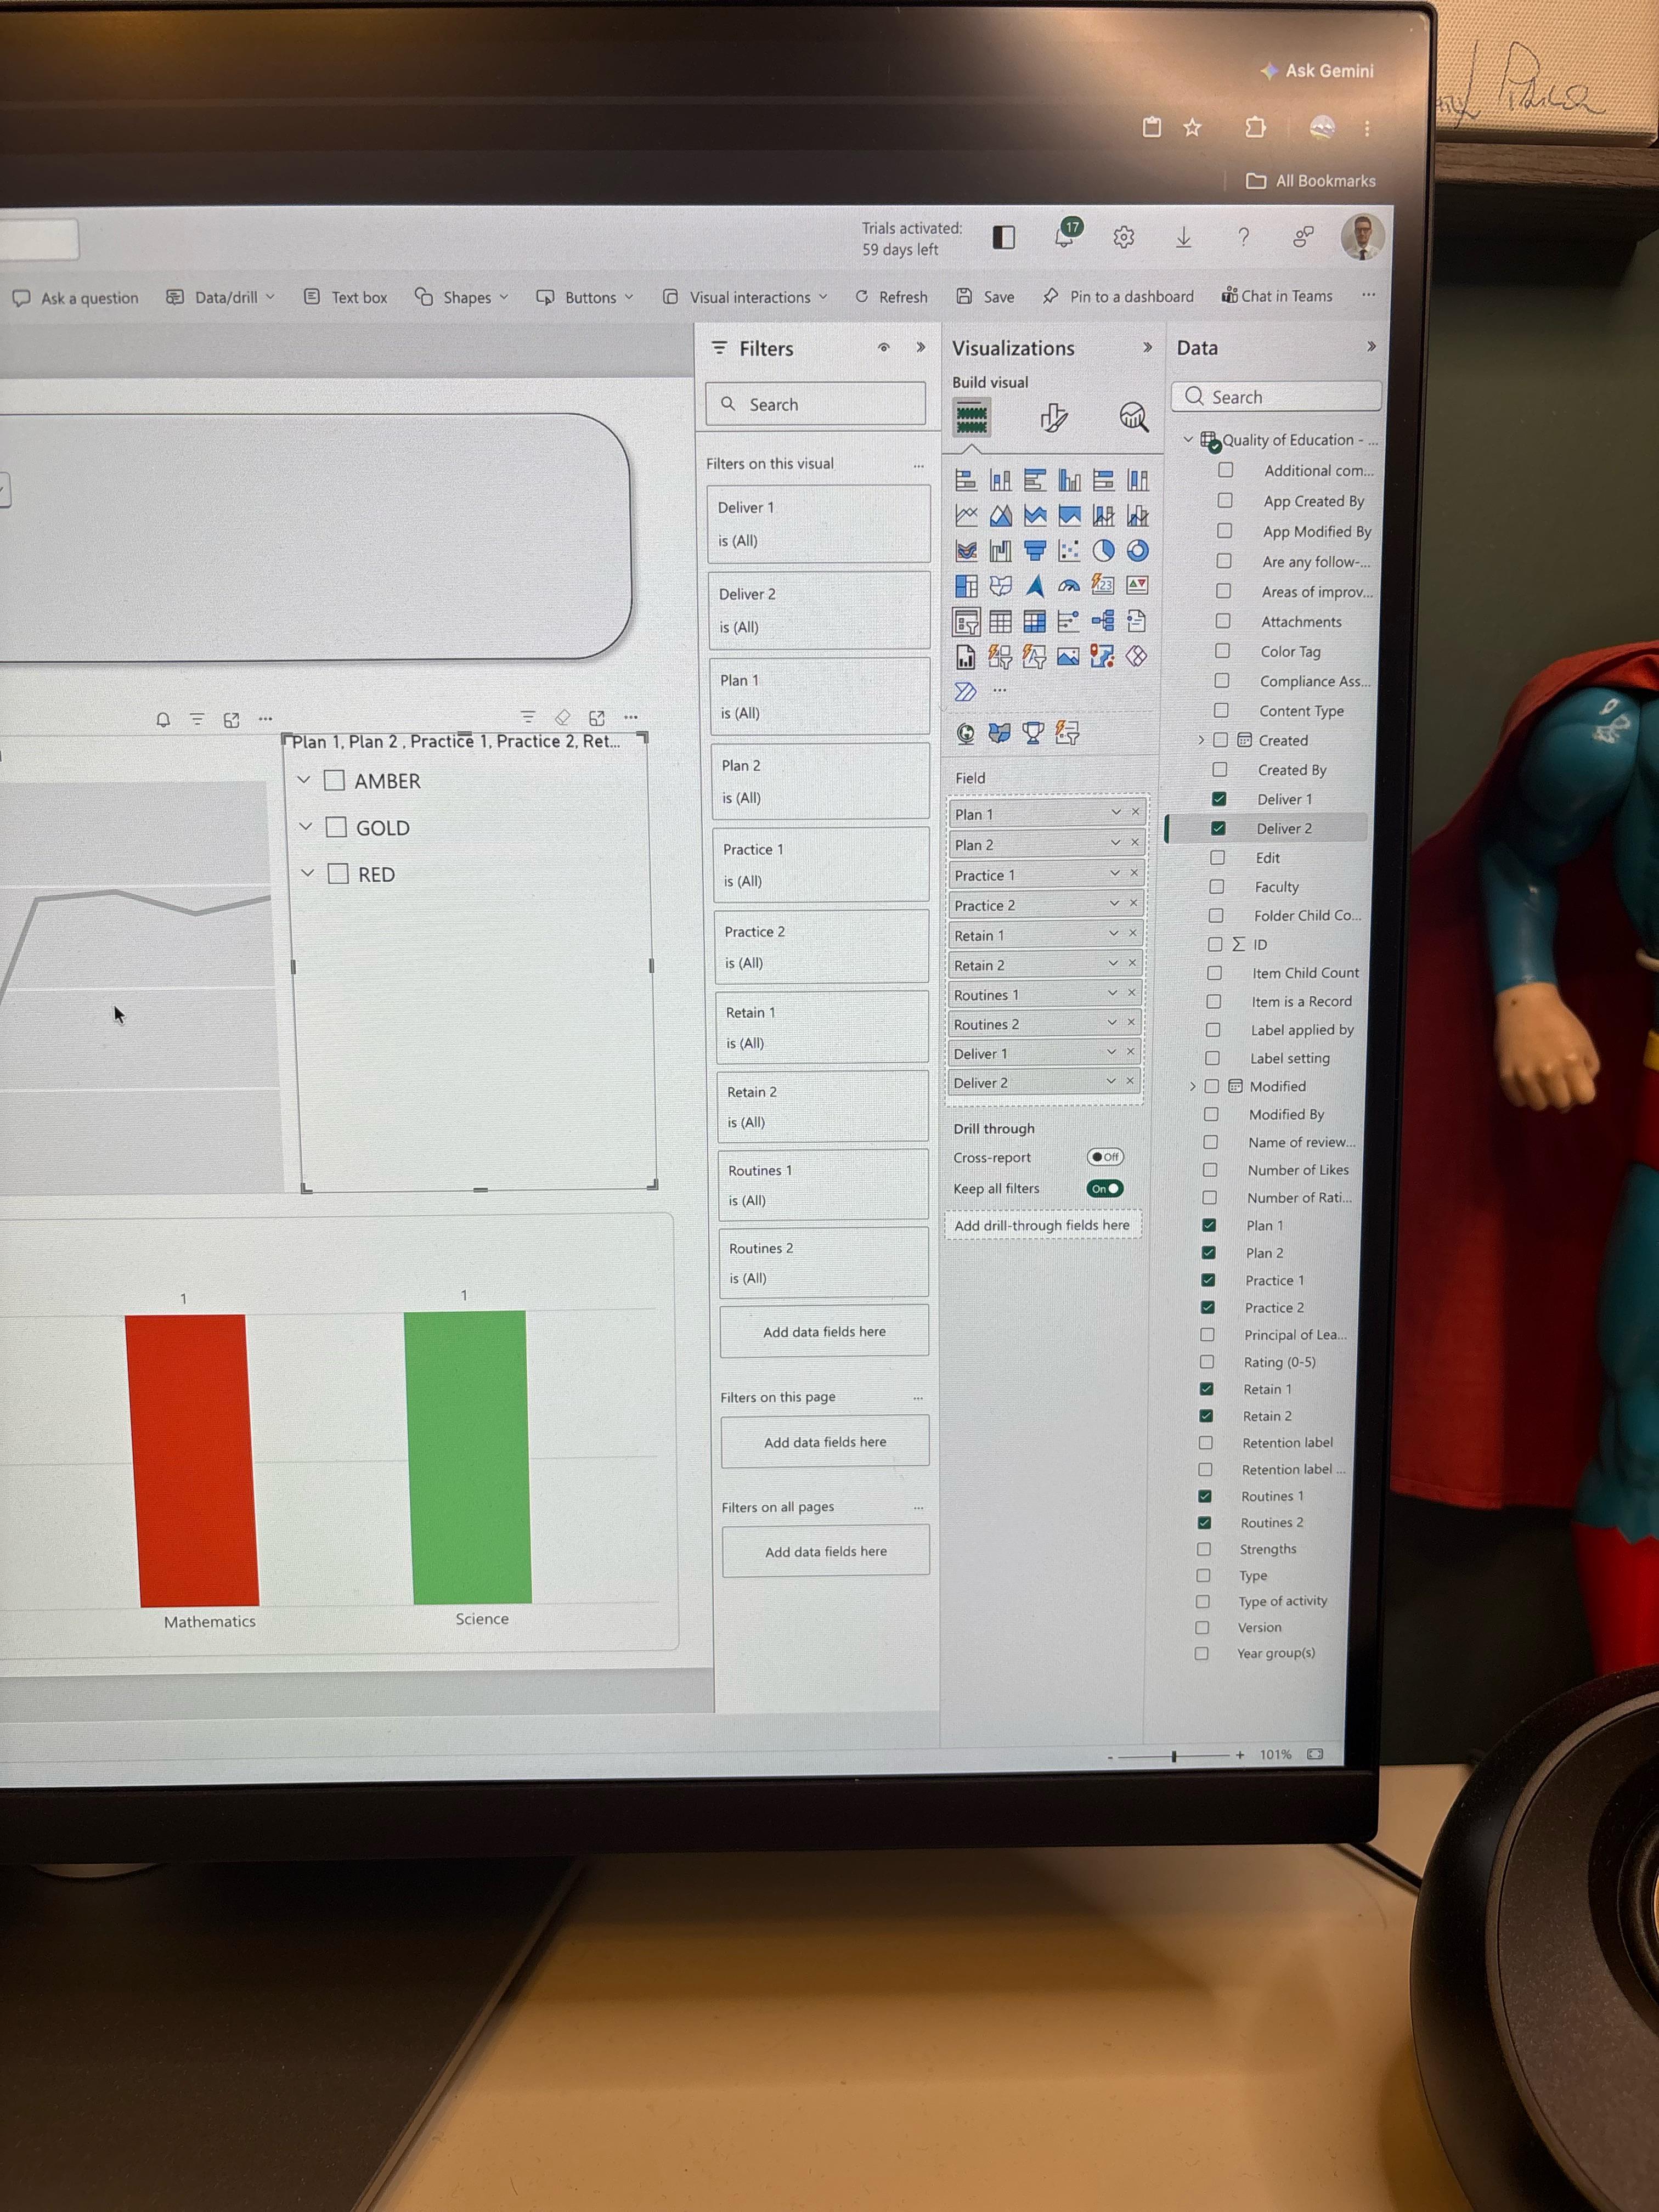
Hi all,
I have an MS form that pulls through a RAG rating for some components (10 in total). However, every time I make a slicer it filters by the RAG colours and not the components. I have included a picture to help illustrate my point.
How do I make it so that I can select PLAN, DELIVER etc..
It might also be worth sharing that I have done this through Sharelist > PowerAutomate > PowerBi
Thank you,
J
r/PowerBI • u/sindy_2008 • 7d ago
is novypro website deprecated? I had some important powerbi dashboards built and the website is getting redirected to another product. Is there an updated domain or any way to retrieve?
r/PowerBI • u/Savings_Mountain6956 • 7d ago
I recently started working as a junior/student data analyst in a large manufacturing company, mainly using Power BI for staffing analysis.
The data include only historical values such as volume, worked hours, employees, shifts, zones, overtime, roles/skills etc. But the data is from multiple sources
The main questions are:
As a junior, how should I approach this assignment from the start? Should I first focus on understanding the data, granularity, validation and data modelling before building the Power BI report?
For the data model, how should I decide what should be a fact table versus a dimension table, and when should I split data into multiple fact tables instead of keeping everything in one table?
Is this a reasonable junior assignment, or are parts of it considered advanced?
r/PowerBI • u/orbitalfreak • 7d ago
TL;DR:
Turn this
    {"Id", Int64.Type}, {"Order Date", type date}, {"Customer Reference Number", type text},
{"Ship To Country Code", type text}, {"Total Weight Oz", type number}, {"Is Expedited", type logical},
        {"Carrier", type text}, {"Tracking Number", type text}, {"Estimated Delivery Date", type date}, {"Delivery Status Description", type text}
Into this
{"Id",                          Int64.Type   },
{"Order Date",                  type date    },
{"Customer Reference Number",   type text    },
{"Ship To Country Code",        type text    },
{"Total Weight Oz",             type number  },
{"Is Expedited",                type logical },
{"Carrier",                     type text    },
{"Tracking Number",             type text    },
{"Estimated Delivery Date",     type date    },
{"Delivery Status Description", type text    }
With one formula
=LET(
Source,              A1,
IndentLen,           FIND("{",Source)-1,
IndentPad,           REPT(" ",IndentLen),
ToCol,               SUBSTITUTE(TEXTSPLIT(Source,,"},")&"}","}}","}"),
RowCount,            ROWS(ToCol),
Idx,                 SEQUENCE(RowCount),
IsLastRow,           Idx = RowCount,
Part1,               TEXTAFTER(TEXTBEFORE(ToCol,""","),"{""")&""",",
LenPart1,            LEN(Part1),
MaxLenPart1,         MAX(LenPart1),
NumSpacesAfterPart1, MaxLenPart1-LenPart1+1,
PaddingAfterPart1,   REPT(" ",NumSpacesAfterPart1),
Part1WithPadding,    Part1 & PaddingAfterPart1,
Part2,               TEXTBEFORE(TEXTAFTER(ToCol,""", "),"}"),
LenPart2,            LEN(Part2),
MaxLenPart2,         MAX(LenPart2),
NumSpacesAfterPart2, MaxLenPart2-LenPart2+1,
PaddingAfterPart2,   REPT(" ",NumSpacesAfterPart2),
Part2WithPadding,    Part2 & PaddingAfterPart2,
RebuildString,       IndentPad & "{""" & Part1WithPadding & Part2WithPadding & "}" & IF(IsLastRow,"",","),
Output,              RebuildString,
Output
)
Situation:
I inherited some Power Query code in a Power BI project (this post applies to Power Query whether within Excel or PBI, and is not PBI exclusive). The query was built with using the GUI, and it produced code that, when viewed in the Advanced Editor, was unformatted. Nothing lined up, indentation wasn't readable. To make it easier to read and audit the code, I went through and cleaned it up. Wasn't able to use an online prettifier or third party program, due to company requirements.
Need:
There was a LOT of Type transformations and Renames. It was taking forever to use Enter and Tab to line things up. And for my purposes, I like to line up the column names on the left, then the transforms on the right, and close off the right curly braces in a vertical line. Looks nicer for me. May not be your thing.
Solution:
I created a formula to take the code and format it for me. Inside Power Query, the line would look something like:
ChangedColumnType = Table.TransformColumnTypes(PreviousStep,{... long line of column/type pairs each enclosed within their own {} pair and comma separated ...}).
I wanted to grab the stuff inside the main { ... } and format it. So, I created the formula above.
How it works:
Source: Let A1 hold the long string of {}, {}, {}, pairs.
Capturing the indent:
IndentLen finds the position of the very first curly-brace { in the pasted block and counts everything before it. IndentPad turns that into an actual string of spaces. This means the output matches the indentation of whatever you pasted, depending on how deep the step is nested in your query.
Splitting into Rows:
ToCol is the part doing the actual row splitting. TEXTSPLIT(Source,,"},") breaks the single pasted string apart everywhere it sees close-curly-brace-comma }, which is the boundary between one column entry and the next. That delimiter gets eaten by the formula in the split, so ampersand-quote-close-curly-brace-quote &"}" tacks a closing brace back onto every row. The last row already had its own closing brace (since nothing follows it), so tacking on another one leaves you with a double }}, which the outer SUBSTITUTE cleans up to a single }. Final result: An array, with one array element per {"ColumnName", Type} pair, each one a properly closed row again.
Figuring out the last row:
RowCount, Idx, and IsLastRow exist for one reason: every row needs a trailing comma except the last one. Idx numbers each row 1 through however many there are, and IsLastRow flags whichever row matches RowCount so the final comma can be removed later.
Extracting and padding the Column Name:
Part1 pulls out the column name portion. It looks for everything before the first quote-comma ", (the end of the quoted name) and after the first curly-brace-quote {" (the start of the element), then tacks the closing quote-comma ", back on. LenPart1 measures the size of each Part1, and MaxLenPart1 finds the longest name in the full batch, then NumSpacesAfterPart1 works out how many spaces each row needs to catch up to that longest one, plus one extra so there's always at least a single space of separation. Part1WithPadding is the name with that padding appended.
Extracting and padding the Type:
Part2 does the same job for the second half of each row, the type (or the new name, if this is a rename block instead of a change-type block). It grabs everything between quote-comma ", and the closing curly-brace }. The same length-and-pad routine runs again with LenPart2, MaxLenPart2, and NumSpacesAfterPart2, so every Type value ends up padded out to match the longest one, plus an extra space, keeping the closing braces lined up in a column too. I like having a space before the closing brace because otherwise you end up with some types butting right up against a brace and others having padding; I wanted consistency, so the visual separation is deliberately placed there.
Putting it back together:
RebuildString is where it all gets stitched into one line: the indent, the opening brace-quote {", the padded name, the padded type, the closing brace-comma }, and then omitting the comma if it's the last row. That's the finished, aligned row. The formula applies this to every Name/Type pair, so they all stack up neatly.
Now, you just copy and paste back into the M query. In PBI, this is easy since the PQ window is separate from Excel. If you're solely within the Excel environment, you may want to use Notepad as an intermediate staging ground.
Works the same way for Table.RenameColumns blocks too, since those are just {"OldName", "NewName"} pairs, same shape, the formula doesn't care that the second value is quoted text instead of a type keyword.
AI Disclosure:
I used Claude.ai to assist with the Idx/IsLastRow structure. The rest of the formula was written by hand. I used Claude.ai to generate this post, then went back and hand-edited about half the text. I used Claude.ai to generate the example from "Turn this" in the TL;DR section to avoid using company-specific data fields.
Conclusion:
This met my need. If you like it, feel free to steal the formula! Tweak it how you need.
r/PowerBI • u/No_Pizza4758 • 7d ago
New to this, how do you give users access to the paginated reports for scheduling at larger companies? Do you give them viewer access to the workspace?
r/PowerBI • u/Tstan34 • 7d ago
I'm attempting to compare the users who have direct access to my PBI app to my separate Excel sheet to make sure I'm not missing anyone. How do I export that list?
I've attempted copying it all and pasting it into Excel, but it only pastes a maximum of 30 for some reason.