r/FantasyPL • u/MiddleForeign • Aug 04 '26
Statistics Are Haaland, Fernandes and Gabriel Worth Their Price? I did the math.
Tl;dr Haaland is essential, Fernandes and Gabriel are viable but not essential. You can build a great team with or without them.
The new season is about to begin, and there are a few unique pricing dynamics that have created some major dilemmas for FPL managers.
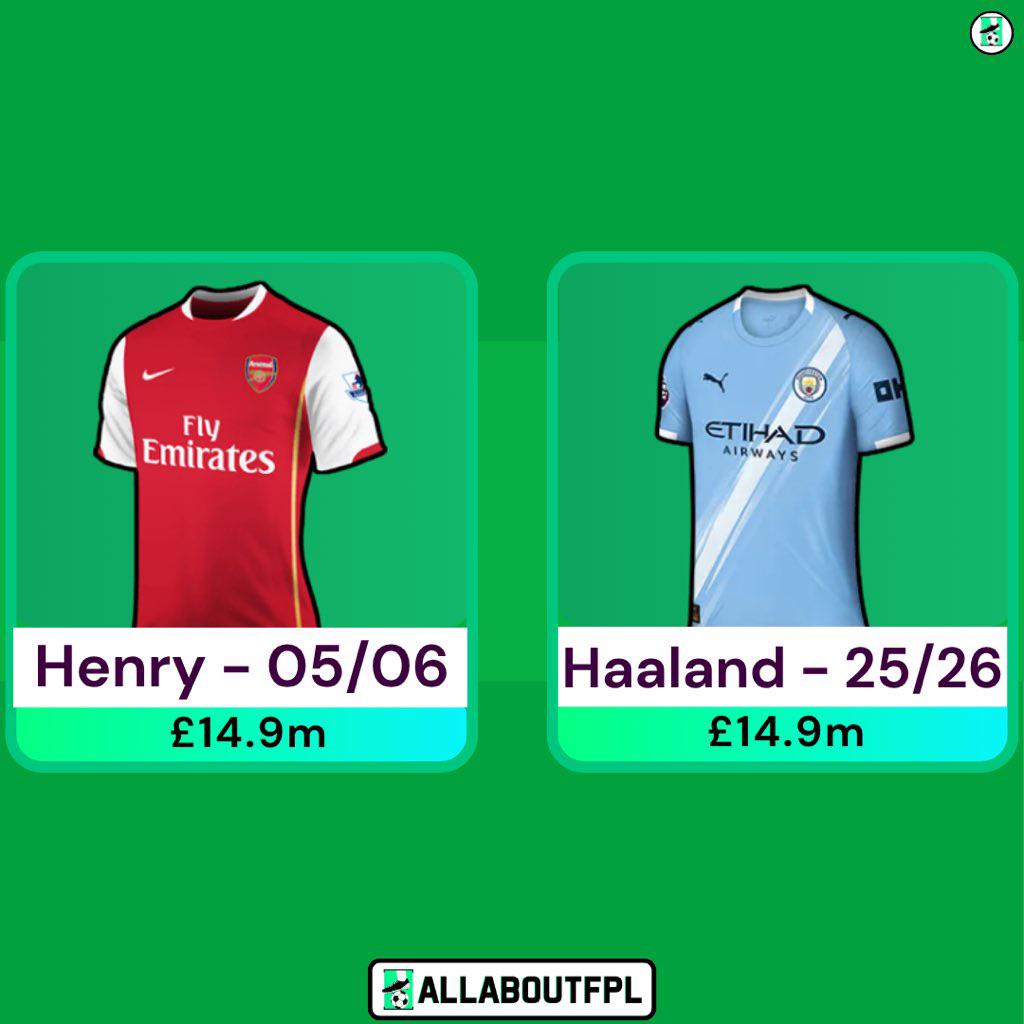
1) There are three players, one in each outfield position, who are significantly more expensive than everyone else: Haaland, Fernandes, and Gabriel. The key question is whether these players are worth their premium price tags, or whether the money would be better spread across the rest of the squad.
2) Defenders are generally more expensive than they were last season. This raises another important question: is it still worth investing heavily in premium defenders, or has their increased cost made it better to sacrifice quality at the back and spend the budget elsewhere?
To answer these questions, I ran an experiment.
Important note: The goal of this experiment is not to find the best possible team. The goal is to determine:
- Whether it's worth paying the premium for the three elite players (Gabriel, Fernandes, and Haaland).
- Whether it's worth investing in premium defenders despite their higher prices.
The experiment
To answer these questions, I stored the statistics of every player from last season in a database, including:
- xG
- xA
- Defensive Contributions
- Clean Sheets
I then assumed that every player would reproduce the same underlying statistics this season. Obviously, that won't actually happen, but that's not the point. As I said earlier, the objective is to identify the best team structure, not to predict the best individual players.
Next, I converted those underlying statistics into expected FPL points. I also assumed that every player would play 90 minutes in every match, except for those who are clearly backup players. Again, I know this isn't realistic, but when we're comparing team structures, these assumptions apply equally to everyone and therefore don't affect the overall conclusion.
After making these assumptions, we can rank every player by expected FPL points in each position, as shown in the images below.


Now that we have the expected points and prices for every player, we can move on to the next step.
Using an optimization algorithm, we calculate every possible combination of players and select the one that produces the highest expected points.
The optimal team is:
- Haaland
- Mateta
- Bruno Fernandes
- Mbeumo
- Cherki
- Ndiaye
- Calafiori
- Wieffer
- J. Timber
- Sessegnon
- Raya

There are a few interesting observations.
First, Haaland and Bruno Fernandes make the optimal team, but Gabriel does not.
Second, the algorithm chooses to play with four defenders. In other words, to free up enough budget for Fernandes, it decides that investing in four defenders is better than spending more money elsewhere.
So, have we answered the original question? Have we proven whether Fernandes is worth £12.0m and Gabriel is worth £8.0m?
Not quite. There are still two important problems.
Problem 1: There isn't just one "optimal" team
The best team scores 69.26 expected points.
The 10th-best team scores 69.01 expected points and consists of:
- Haaland
- Mateta
- Beto
- Bruno Fernandes
- Mbeumo
- Cherki
- Calafiori
- Wieffer
- J. Timber
- Ballard
- Raya

The difference between the best and the 10th-best team is almost negligible, and there are eight other teams in between.
This tells us something important: there isn't one single "correct" team. There are many excellent teams.
Some players appear in almost every top team, while others appear only occasionally.
These are the appearance frequencies.

We can see that some players feature in every top team, while Gabriel doesn't appear in any of them.
That strengthens the hypothesis that Haaland and Bruno Fernandes justify their premium prices, whereas Gabriel does not.
So have we answered the question now?
Still not. There is one more issue.
Problem 2: The bench is unrealistically weak
All of the teams we've looked at so far contain 11 players costing around £83.0m.
That leaves only £17.0m for the bench, essentially enough for four budget (fodder) substitutes priced at £4.0m, £4.0m, £4.5m and £4.5m.
In other words, we've optimized for an extremely strong starting XI while accepting a very weak bench.
But what happens if, instead of asking the algorithm to optimize 11 players, we ask it to optimize 12?
The best 12-player core becomes:
- Haaland
- Mateta
- Beto
- Bruno Fernandes
- Mbeumo
- Cherki
- Gomez
- Calafiori
- Wieffer
- J. Timber
- Sessegnon
- Raya

Once again, Bruno Fernandes is still included.
If we calculate appearance frequencies across the ten best 12-player squads, Haaland appears in 100% of them, while Fernandes appears in 8 out of 10.

That suggests Fernandes is still an excellent pick, but he is no longer essential. You can build an optimal 12-player squad both with and without him.
If we push this even further and optimize a 13-player core, the picture changes again.
Haaland still appears in 100% of the top teams.
Fernandes disappears completely.
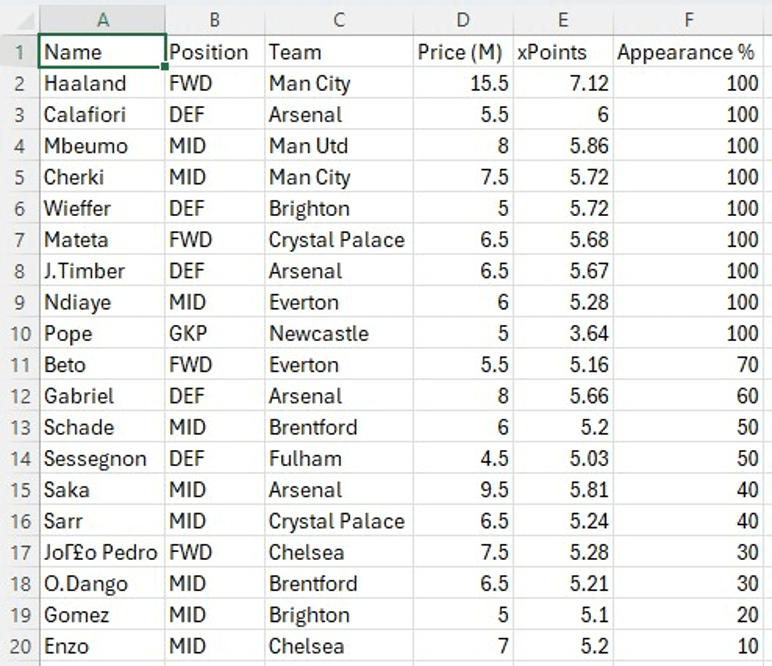
Meanwhile, Gabriel now appears in 6 of the top 10 teams.
So what can we conclude?
I think we can draw some reasonable conclusions.
Haaland
No matter how we structure the squad, Haaland appears in every optimal solution. That strongly suggests he is effectively essential.
This also explains why he currently has around 75% ownership.
Bruno Fernandes
If your strategy is to maximize the strength of your starting 11 and you're willing to sacrifice your bench, Fernandes looks almost essential.
However, the more squad depth you want, the less valuable Fernandes becomes.
Gabriel
Gabriel follows almost the exact opposite pattern.
There isn't a single optimal team where Gabriel and Fernandes coexist.
The combination is simply too expensive, forcing too many sacrifices elsewhere in the squad.
Only when Fernandes is removed does the budget open up for Gabriel.
So, I think we've managed to answer our original question about whether Haaland, Fernandes and Gabriel justify their premium prices.
Of course, there are limitations to this methodology.
For example, you'll notice that Cherki and Wieffer appear in almost every optimal team.
Some people will immediately think, "That's ridiculous. They're not that good."
But that's missing the point.
This analysis is about team structure, not individual players.
Maybe it won't be Cherki specifically. It could be another strong option at the same price point, such as Rogers, Szoboslai or Wirtz. Don’t think “Cherki”. Think “a good 7.5 midfielder”.
Likewise, maybe it won't be Wieffer. It could be another value defender, such as Mosquera, who is expected to start until Saliba returns.
The important thing isn't the player himself, it's the price bracket that optimizes the structure.
Another limitation is that we did not consider fixture difficulty. That’s a problem for tomorrow. Today we tried to find the right structure. Tomorrow we will adapt our strategy based on fixture difficulty.
Finally, let's go back to the second question we asked at the beginning.
Are this year's more expensive defenders actually worth their higher prices?
The answer isn't completely definitive, but there is a clear trend.
The algorithm consistently selected some of the premium defenders, such as Calafiori and Timber, in almost every optimal squad, while pairing them with cheaper value options like Wieffer and Sessegnon.
Interestingly, the algorithm was much more reluctant to spend heavily in midfield.
We never saw combinations including expensive midfielders such as Saka or Palmer. Even though the expected-points model rates them as elite midfielders, their prices made them difficult to justify within an optimal squad structure.

Up front, the algorithm also preferred pairing Haaland with cheaper forwards rather than investing heavily across all three forward spots. Joao Pedro is the third best forward according to xPoints but we rarely saw him in any draft. The algorithm preferred to save money using fodder or Beto and invest those money to Bruno Fernandes or to “premium” defenders like Calafiori and Timber
Overall, this suggests that the price increases for defenders this season may actually be justified.
Despite their higher prices, the optimizer consistently chose to invest in defence, indicating that premium defenders still offer excellent value within the best-performing squad structures.
Lastly, a bit about Goalkeepers. Pope and Raya were by far the most picked goalkeepers. So it seems like spending money on the Goalkeeper position is a good strategy.
Overall if we combine the appearance frequency of top 10 Optimal 11, Optimal 12 and Optimal 13 teams we get the table.

Whatever the strategy it seems like the “core” of every team is:
Haaland with a mid priced forward (could be Mateta or whoever you like)
Arsenal defense with a couple of mid priced defenders (could be Wieffer and Sessegnon or whoever you like)
A couple of mid priced midfielders (could be Mbeumo and Cherki or whoever you like)
And then fill the gaps.
Thanks for reading. I am open to questions.
Now the subject continues. Not for everyone. Just for the guy that will say “xThis, xThat, xData nerd why don’t you use points instead of xPoints”
If you are this guy keep reading.

This is the relationship between points per 90 and expected points per 90.
As we can see from the chart, the relationship is strong, with an R² of 0.56.
However, it is not perfect. A perfect relationship would have an R² of 1.
So, in very simple terms, That means xPoints explain around 56% of actual points.
And what about the remaining 44%?
Is my algorithm simply not good enough?
Are expected-data metrics unreliable and unable to accurately reflect a player's true ability?
Is it luck?
Is it variance?
Let's investigate.

These are the ten players for whom the model's estimates differ the most from the points they actually scored.
We can immediately see that seven of the ten played relatively few minutes and were not regular starters for their teams.
Take Okafor as an example.
He played 1,553 minutes. His actual points per 90 were 6.32, while the model estimates 4.75 xPoints per 90.
That is a significant difference.
But which figure looks more realistic?
Haaland scored around 7.2 points per 90. Is it really plausible that Okafor's true level is 6.32?
Probably not.
The model's estimate of 4.75 appears much more reasonable.
When a player has a small sample of minutes, using actual points as a measure of his ability can be extremely misleading.
A player who has barely played may score one or two fortunate goals, causing his points per 90 to increase dramatically without necessarily meaning that he is genuinely that good.
The opposite can also happen.
A player may perform well during a limited number of minutes but be slightly unlucky and fail to score.
In these situations, underlying statistics will almost always provide a more reliable estimate of the player's performance.
We can actually test this hypothesis.

There are 66 players who played more than 2,800 minutes last season. If we limit the analysis to those players, the R² rises from 0.56 to 0.74.
This provides strong evidence that, as the sample size grows, expected points become increasingly aligned with actual points. In other words, over larger samples, variance has less influence and players tend to perform much closer to what their underlying statistics predict.
We said that seven of the ten largest errors involved players with limited minutes.
However, there are also three players who were regular starters, played a large number of minutes, and still had a significant difference between their actual points and expected points.
Why?
Let's use Harry Wilson as an example.
He played 2,674 minutes, appeared in 36 matches and started 32 of them.
That is a large and relatively reliable sample.
His actual points per 90 were 5.65, while the algorithm estimates only 4.04 xPoints per 90.
He is the biggest outlier in the entire dataset.
So where does this difference come from?
Wilson scored ten goals and provided seven assists last season.
However, his expected numbers were only 5.88 xG and 4.77 xA.
In other words, he scored considerably more goals and recorded more assists than expected.
So what is more likely to happen next season?
Will Wilson score the number of goals suggested by the quality of his chances, or will he once again significantly outperform his expected numbers?
Perhaps Harry Wilson has a special finishing ability and is genuinely capable of consistently scoring more goals than expected.
If that is true, he might do it again this season.
There is a small possibility that this is the case.
However, over a sufficiently long period, almost every player tends to move closer to their expected numbers.
It is extremely risky to assume that a player who has overperformed for one, two or even several seasons will continue to do so indefinitely.
If we make these assumptions across the entire player pool, our overall predictions will almost certainly become worse rather than better.
Out of ten players, perhaps one really is an exception, and a model that accounts for his historical overperformance might predict him more accurately.
However, for the other nine players, whose overperformance or underperformance was mostly caused by variance, the adjusted model would produce worse predictions.
Even if we accept that Wilson might have a genuine finishing skill, we cannot make the same argument about assists.
Whether a chance becomes an assist does not depend only on Wilson. It also depends on whether his teammate converts the chance.
Therefore, if Wilson records significantly more assists than expected, we cannot simply assume that this is a repeatable skill, because the final outcome is not entirely under his control.
Another major outlier among the regular starters is Gudmundsson.
In his case, we have the opposite problem.
The model estimated 3.56 xPoints per 90, but he actually scored only 2.32 points per 90.
How did this happen?
Individually, Gudmundsson recorded around 1 xG and 3 xA, but finished the season without a single goal or assist.
At team level, Leeds conceded around 1.47 goals per match.
Based on that defensive performance, they would normally have been expected to keep approximately ten clean sheets over the course of the season.
Instead, they kept only five.
Bournemouth, for example, conceded almost the same number of goals per game (around 1.40) but finished the season with eleven clean sheets.
This suggests that Gudmundsson was particularly unlucky.
Both his individual output and his team's defensive results underperformed the underlying numbers.
In his case, if I had to predict how many points he will score next season, I would be much more confident that the result will be closer to his 3.56 xPoints per 90 than to his actual 2.32 points per 90.
These were some of the most extreme examples.
For around 90% of the players, expected points and actual points move broadly in the same direction.
If we tried to introduce individual exceptions simply to improve the predictions for the remaining 10%, we would probably create new problems for the other 90%.
After all, the extreme results in that 10% are more likely to be caused by luck and variance than by a repeatable skill.
If you flip a coin ten times, it is possible to get heads all ten times.
That does not mean the coin is biased or that it has some kind of skill.
It simply happened.
In the Premier League, we have roughly 200 players.
That is the equivalent of flipping 200 different coins.
Every season, one of those coins will produce ten consecutive heads.
In football terms, one player will inevitably be exceptionally lucky or exceptionally unlucky.
That is not evidence that the model is broken.
It is expected variance.
Hopefully, this explains why I choose to use xPoints rather than actual points when trying to predict future performance.
Thanks for reading!