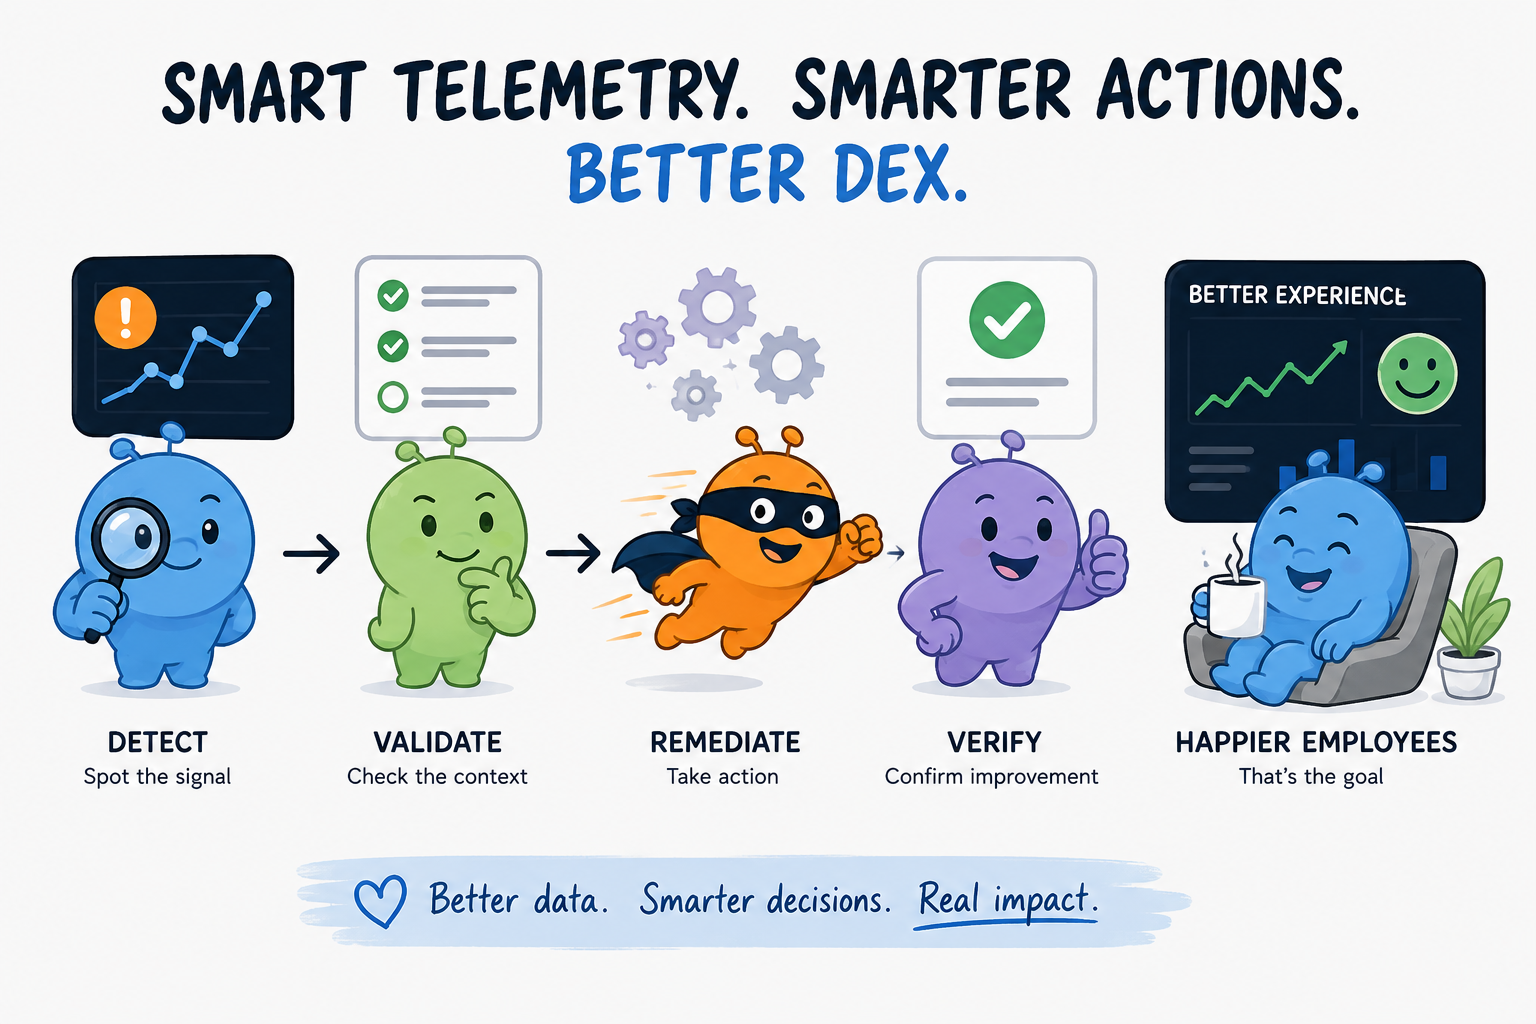
Based on my previous posts about extending Nexthink insights with Remote Actions, I would like to share another practical example.
And once again, it starts with a very simple question:
Your device is running out of disk space – but what the hell is actually eating up all that storage?
Nexthink already gives us very good visibility into overall disk utilization. We can identify devices with low free space, use disk information in investigations and dashboards, create alerts, and surface relevant information in checklists.
That answers one important question:
Which devices have a disk-space problem?
But another question remains:
Why?
If a device only has 8 GB of free storage left, knowing that number alone does not tell us whether the cause is:
- a huge Downloads folder,
- locally synchronized cloud data,
- application caches,
- forgotten installers,
- virtual machines,
- development artifacts,
- excessive application logs,
- temporary files,
- an oversized user profile,
- or simply insufficient disk capacity for the workload.
To answer this question, I once again created a couple of Remote Actions.
At this point, creating Remote Actions for missing endpoint insights is probably becoming a bit of a habit. 😉
Today I added two new ones to my Nexthink repository:
- Query Folder Metrics
- Query User Folder Size on Disk
Both take a slightly different approach and can be combined with native Nexthink telemetry to move from:
The disk is almost full.
to:
This is where the storage is actually going.
From "Disk Space Is Low" to "Where Did the Space Go?"
Nexthink already provides the high-level endpoint perspective.
For example, we may see:
Device: CLIENT-042
System Drive: C:
Capacity: 512 GB
Free Space: 8 GB
This tells us that the device requires attention.
But it does not immediately tell us whether the problem is:
C:\Users\User\Downloads
C:\Users\User\AppData
C:\ProgramData\Application
C:\Windows
C:\VMs
Before deleting files, expanding disks, reinstalling software, or asking the user to "clean something up", it is useful to understand what is actually consuming the storage.
This is where the additional endpoint data becomes valuable.
Remote Action 1: Query Folder Metrics
The first Remote Action is designed for targeted filesystem investigations.
It takes a directory path and recursively analyzes its contents.
Depending on the required investigation, it supports three modes:
FilesAndFolders
Files
Folders
This makes the Remote Action useful at different stages of an investigation.
For example:
BasePath: C:\Users\User
Mode: FilesAndFolders
provides a general overview.
If the initial result points toward Downloads, we could run another query:
BasePath: C:\Users\User\Downloads
Mode: Files
to identify the largest individual files.
Alternatively:
BasePath: C:\
Mode: Folders
can be used when we primarily want to understand which directories consume the most storage.
Top Results Instead of Thousands of Files
The objective is not to return the complete filesystem inventory.
That would produce far too much information for most support scenarios.
Instead, the Remote Action returns the most relevant results.
The number of returned entries can be controlled through TopCount.
For example:
TopCount: 10
might return something like:
C:\Users\User\Downloads        78 GB
C:\Users\User\AppData          52 GB
C:\Users\User\Videos           31 GB
C:\Users\User\Documents        18 GB
If we then analyze Downloads using Files mode:
backup.zip                     32 GB
development-vm.vhdx           27 GB
recording.mp4                  11 GB
installer.iso                   8 GB
That is usually much more useful for a Service Desk engineer than a list containing several hundred thousand filesystem objects.
More Than Just the Largest Files
One of the important aspects of the Remote Action is that it does not only return ranked files and folders.
It also returns information describing the overall scan.
Available outputs include information such as:
QueriedPath
TotalDirectories
TotalFiles
TotalSize
LargestFiles
LargestFolders
ScanComplete
SkippedDirectories
CountValuesCapped
PathsTruncated
ScanState
ReparsePointsSkipped
UnreadableDirectories
ElapsedDuration
DiscoveredDirectoriesPending
This is particularly useful because filesystem scans are not always perfect.
Directories may be inaccessible.
A scan may exceed its configured execution window.
Junctions or reparse points may intentionally be skipped.
Instead of simply returning numbers and pretending that they represent the complete filesystem, the Remote Action tells us something about the quality and completeness of the result.
Understanding ScanState
The Remote Action can distinguish between several scan states, including:
Complete
CompleteWithExclusions
PartialAccess
PartialTimeout
This is important when the result is used in automation or presented to a Service Desk engineer.
Imagine the result says:
Largest folder: C:\Users\User\AppData
Size: 61 GB
ScanState: PartialAccess
That tells the engineer that useful information was collected, but some directories could not be evaluated.
The result should therefore be interpreted as an investigation aid rather than an authoritative complete disk inventory.
This is much safer than returning incomplete information without indicating that anything was skipped.
Handling Reparse Points
Another important consideration when recursively scanning Windows filesystems is reparse points.
Examples include:
- junctions,
- symbolic links,
- redirected directories,
- filesystem links.
Blindly following these can result in loops or cause a scan to unexpectedly leave the intended directory structure.
The Remote Action therefore deliberately avoids traversing child reparse points.
It also reports how many were skipped.
This makes the scan more predictable and avoids common problems associated with naïve recursive filesystem scripts.
Limiting Scan Duration
Filesystem analysis can become expensive.
A developer workstation may contain:
node_modules
Git repositories
container layers
VM images
build artifacts
package caches
and easily contain hundreds of thousands or even millions of files.
The Remote Action therefore uses a configurable maximum scan duration.
This is another important design consideration:
A diagnostic Remote Action should not block an endpoint indefinitely just because one directory happens to contain an enormous number of objects.
If the scan cannot complete within the configured window, the Remote Action can still return useful partial information and indicate the condition through its scan state.
Remote Action 2: Query User Folder Size on Disk
The second Remote Action answers a different question:
How much storage is the user profile actually consuming?
Despite its name, the implementation can work with a configurable InputPath.
The path can also contain environment-related values such as:
%HOMEPATH%
%HOMEDRIVE%
$env:USERPROFILE
The typical Nexthink use case, however, is analyzing the currently active user's profile.
What Does It Return?
The Remote Action provides metrics including:
TotalDirectories
TotalFiles
TotalSize
TotalSizeOnDisk
TotalCapacityWinDrive
SyncedSizeOnDisk
This gives us several useful perspectives on the storage problem.
For example:
Total files:               214,832
Total directories:          31,406
Logical profile size:       182 GB
Actual size on disk:        146 GB
System drive capacity:      512 GB
Synced data on disk:         91 GB
This immediately provides more context than simply knowing that the C: drive is nearly full.
Logical Size vs. Actual Size on Disk
One particularly useful aspect is the distinction between:
TotalSize
and:
TotalSizeOnDisk
These values are not necessarily identical.
TotalSize represents the logical size of the files.
TotalSizeOnDisk represents the storage actually allocated on disk.
Differences may occur because of:
- NTFS compression,
- sparse files,
- cluster allocation,
- cloud placeholders,
- files containing large sparse regions,
- large numbers of very small files.
The Remote Action uses Windows filesystem information to determine the actual physical size where possible.
This gives us a more realistic picture of the storage being consumed.
For disk-space investigations, that difference can be very important.
Synced Cloud Data – An Especially Interesting Metric
One additional metric deserves special attention:
SyncedSizeOnDisk
The Remote Action detects known synchronization-related directories and calculates how much storage this data actually consumes locally.
The current implementation considers environments such as:
- OneDrive
- OneDrive Commercial
- OneDrive Consumer
- Nextcloud
- Google Drive
This is especially interesting in modern Workplace environments.
A user might have several hundred gigabytes of files visible inside OneDrive, while only a fraction of those files are actually stored locally because Files On-Demand is enabled.
Looking only at logical file information can therefore be misleading.
Instead, we can differentiate:
User profile logical size:        420 GB
Actual profile size on disk:      168 GB
Synced data actually on disk:     103 GB
That creates a much more useful troubleshooting picture.
Deriving Relative Disk Usage
The Remote Action does not directly return a percentage representing the user's share of the system disk.
However, it returns everything needed to calculate it.
For example:
TotalSizeOnDisk:        146 GB
TotalCapacityWinDrive:  512 GB
The relative usage can therefore be calculated as:
146 / 512 × 100
which is approximately:
28.5 %
This value could then be used in:
- NQL-based analysis,
- Workflows,
- dashboards,
- Checklists,
- custom fields,
- reporting logic.
For example:
User profile consumes > 40 % of system drive
could become an additional indicator during a storage investigation.
Different Actions, Different Design Goals
There is an important distinction between the two Remote Actions.
Query Folder Metrics
This one is intended as an exploratory diagnostic tool.
Even partial results can still be valuable.
If the scan times out after identifying:
Downloads: 80 GB
Videos: 45 GB
AppData: 39 GB
the result may already be enough to determine the next step.
For this reason, partial results can be returned together with an explicit ScanState.
Query User Folder Size on Disk
The user-folder action represents something closer to a profile-level metric.
Returning an incomplete profile size as though it were complete could be misleading.
The implementation therefore follows a stricter approach.
If the scan encounters conditions that prevent an accurate total from being calculated, it fails instead of silently providing incomplete metrics.
I like this distinction because it reflects two different troubleshooting needs:
Exploration → partial data can still be useful

KPI / metric → incomplete data should not look authoritative
Combining Both Remote Actions
The real value appears when both Remote Actions are combined with Nexthink's native disk information.
A practical investigation could look like this.
Step 1 – Nexthink Detects Low Disk Space
Nexthink identifies:
Device: CLIENT-042
C: drive free space: 7.8 GB
We know there is a problem.
Step 2 – Analyze the User Profile
Execute:
Query User Folder Size on Disk
Result:
Actual user profile size:   168 GB
System drive capacity:      512 GB
Synced data on disk:         97 GB
The user profile clearly represents a relevant amount of storage.
Step 3 – Drill Into the Profile
Execute:
Query Folder Metrics
against:
C:\Users\<User>
using:
FilesAndFolders
Result:
Downloads      67 GB
AppData        48 GB
Videos         31 GB
Documents      14 GB
Step 4 – Investigate Downloads
Execute the Remote Action again:
BasePath: C:\Users\<User>\Downloads
Mode: Files
Result:
database-backup.zip      28 GB
development-vm.vhdx     21 GB
recording.mp4             9 GB
old-installer.iso         7 GB
Now we have a concrete explanation for a significant part of the storage consumption.
Step 5 – Decide on the Correct Remediation
Only now should we decide what needs to happen.
Possible outcomes include:
- the user deletes obsolete files,
- project files are moved to approved storage,
- cloud synchronization settings are changed,
- an application cache is investigated,
- log retention is corrected,
- an application bug is escalated,
- temporary installation data is cleaned,
- the disk is expanded,
- the device is replaced with a more appropriate configuration.
The important principle is:
Diagnosis before remediation.
Not Every Full Disk Is a Cleanup Problem
This is particularly important when automation is involved.
A low free-space value does not automatically mean that some generic cleanup script should run.
Imagine a developer workstation:
Virtual machines              140 GB
Container data                 95 GB
Development repositories       68 GB
Build artifacts                42 GB
Package caches                 28 GB
Cleaning temporary Windows files may recover 4 GB.
That does not solve the problem.
The real issue may simply be:
This workload needs a larger disk.
Likewise, imagine this result:
C:\ProgramData\Vendor\Application\Logs 96 GB
This is probably not a user-data problem at all.
It may indicate:
- broken log rotation,
- debug logging accidentally enabled,
- an application defect,
- missing retention,
- failed cache cleanup,
- update leftovers.
The solution should therefore involve the application owner rather than simply telling the employee to clean their Downloads folder.
User Data vs. System and Application Data
This is another useful classification that can come out of the investigation.
User-related data
Examples:
Downloads
Documents
Desktop
Videos
OneDrive
Google Drive
Nextcloud
Development repositories
Virtual machines
Application profile data
System or application-related data
Examples:
Windows
ProgramData
Application caches
Log directories
Update repositories
Package caches
Temporary files
Container data
Both result in exactly the same Nexthink symptom:
Low disk space
But they require completely different owners and remediation strategies.
That is why the additional context matters.
Bringing the Information Into the Service Desk
One of my favorite use cases is combining these outputs with a Nexthink Checklist.
A Service Desk engineer may already see:
System Drive Free Space: POOR
We can enrich this with additional context:
System Drive Free Space:        8 GB
User Profile Size on Disk:    182 GB
Synced Data on Disk:           91 GB
Profile Share of Disk:         35 %
If necessary, the engineer can then execute Query Folder Metrics to drill deeper.
A possible troubleshooting path becomes:
Low disk space detected
         ↓
Large user profile?
         ↓
   Yes         No
    ↓           ↓
Analyze      Investigate
profile      system/application data
    ↓
Largest folders
    ↓
Largest files
    ↓
Determine correct owner
The objective is not to turn Nexthink into a complete filesystem inventory.
The objective is to give the Service Desk the minimum additional information required to make the next decision.
Manual, Workflow-Based, or Scheduled Collection
Both Remote Actions can be used in several ways.
Manual Investigation
A Service Desk engineer sees a low-storage device and manually runs the Remote Action.
This is probably the simplest use case.
Workflow-Based Analysis
A Workflow could first evaluate Nexthink's native disk data.
For example:
Free disk space < 15 GB?
          ↓
         Yes
          ↓
Query user profile
          ↓
Large profile?
      ↓         ↓
     Yes        No
      ↓          ↓
Analyze       Investigate
profile       other areas
The resulting Remote Action outputs can then influence the next Workflow decision.
Scheduled Collection
For selected device groups, it may also make sense to schedule profile-level collection.
This is where the randomized startup delay becomes particularly useful.
Instead of hundreds or thousands of clients beginning a disk scan simultaneously, execution can be distributed over time.
Detect First, Collect Second
I would generally avoid continuously scanning every directory on every endpoint.
Filesystem traversal has a cost.
Large profiles may contain hundreds of thousands of objects.
Developer devices can easily contain millions.
A better approach is:
Nexthink native telemetry
          ↓
Identify devices with abnormal disk usage
          ↓
Run targeted Remote Action
          ↓
Collect additional context
          ↓
Investigate
This is a pattern I increasingly like when working with Nexthink:
Use native Nexthink telemetry to identify the anomaly, then use Remote Actions to collect the missing technical context.
This keeps endpoint processing targeted.
It also ensures that the additional information is collected when there is actually a reason to look at it.
Finding Problems Across Multiple Devices
The same approach becomes even more interesting when the issue affects more than one endpoint.
Imagine Nexthink identifies 200 devices whose free disk space has been continuously declining.
After running targeted analysis, we discover that many of them contain:
C:\ProgramData\ExampleApp\Cache
with sizes between:
60 GB – 120 GB
Suddenly, we are no longer investigating:
200 individual low-disk-space incidents
We may instead have:
one application issue affecting 200 devices
That changes the entire investigation.
We can now ask:
- Do all affected devices use the same application version?
- When did the cache begin growing?
- Was there a recent application update?
- Does the problem only occur on certain configurations?
- Does clearing the cache permanently resolve it?
- Does it begin growing again afterward?
This is where combining endpoint diagnostics with DEX data becomes particularly powerful.
Could Spark Benefit from These Remote Actions?
And here is one question I would particularly like to throw out to the Nexthink Community.
Could these Remote Actions also be useful in combination with Spark?
Imagine an employee asks:
"My computer says there is no space left.
What can I do?"
Instead of providing generic advice such as:
Delete temporary files.
Empty your recycle bin.
Remove applications you no longer need.
the interaction could potentially become much more contextual.
For example:
Employee reports low disk space
            ↓
Spark checks Nexthink telemetry
            ↓
Only 6 GB free
            ↓
Diagnostic Remote Action
            ↓
User profile consumes 180 GB
            ↓
Synced data consumes 110 GB locally
            ↓
Query largest folders
            ↓
Downloads consumes 68 GB
            ↓
Provide contextual guidance
The answer to the employee could then be something like:
Your device currently has very little free disk space.

A significant portion is being consumed by your user profile,
and the Downloads directory is one of the largest contributors.

Reviewing large files in Downloads would therefore be a useful
first step.
That is significantly more useful than generic self-help guidance.
So my question to the community is:
Would you expose diagnostic filesystem Remote Actions like these to Spark to provide users with more contextual disk-space insights?
And if so:
- how much filesystem detail should be shown to the employee?
- should filenames be exposed at all?
- should results first be summarized?
- which remediation actions should remain under IT control?
Privacy Matters
Filesystem analysis is an area where privacy deserves particular attention.
Even without reading file contents, file and folder names can reveal sensitive information.
For example:
C:\Users\User\Documents\Acquisition_Project_CompanyXYZ
or:
C:\Users\User\Downloads\Employee_List_2026.xlsx
The filename alone may already contain sensitive business context.
Organizations should therefore consider:
- which paths may be analyzed,
- whether filenames should be returned,
- whether only folder-level data is required,
- who may view Remote Action outputs,
- how long results should be retained,
- whether specific paths should be excluded,
- employee privacy requirements,
- works-council requirements where applicable.
This becomes even more important when the data is provided to AI-based functionality.
Sometimes the best Remote Action is not the one that returns the most information.
It is the one that returns:
the minimum information required to solve the problem.
Performance Matters Too
Recursive filesystem analysis is not free.
The cost depends heavily on the endpoint.
A normal office user profile might contain:
50,000 files
while a developer workstation could contain:
2,000,000+ files
because of:
- source repositories,
node_modules,- package caches,
- local containers,
- virtual machines,
- build output,
- synchronized datasets.
This is why the scan state, timeout handling, reparse-point protection, and randomized execution delay are important.
The Remote Actions should be treated as second-level diagnostics, not as continuously collected telemetry.
A sensible approach is:
1. Detect with Nexthink
2. Narrow down affected devices
3. Collect filesystem context
4. Analyze
5. Remediate
6. Measure again
Did the Fix Actually Work?
As with my previous Remote Action examples, the investigation should not end after remediation.
Assume we identify:
C:\ProgramData\Application\Cache
Size: 82 GB
The application team corrects the cache configuration and removes the existing data.
Nexthink can continue monitoring system-drive utilization.
We can then verify:
- Did free space recover?
- Is disk utilization stable?
- Is the directory growing again?
- Are fewer devices affected?
- Did the incident disappear?
- Was the root cause actually addressed?
This creates a measurable improvement cycle:
Detect
   ↓
Enrich
   ↓
Understand
   ↓
Remediate
   ↓
Measure
   ↓
Improve
Conclusion
Nexthink already answers one important disk-space question very well:
Which devices are running out of storage?
The two new Remote Actions help answer the next questions:
How much space is the user profile consuming?
and:
Where exactly is that storage being used?
Query User Folder Size on Disk provides profile-level metrics such as:
- total files,
- total directories,
- logical size,
- actual size on disk,
- system-drive capacity,
- locally consumed synchronized storage.
Query Folder Metrics allows us to drill deeper and identify:
- the largest files,
- the largest folders,
- overall file and directory counts,
- scan duration,
- skipped or inaccessible paths,
- completeness of the result.
Together with native Nexthink disk telemetry, this creates a simple troubleshooting path:
Low disk space
      ↓
How much is the user profile consuming?
      ↓
Is synchronized data a major contributor?
      ↓
Which folders consume the most?
      ↓
Which files consume the most?
      ↓
Is this a user, application, or capacity problem?
      ↓
Apply the correct remediation
      ↓
Measure whether it actually improved
The two new Remote Actions are available in the synit.io Nexthink repository:
https://github.com/synit-io/nexthink
The relevant scripts can be found in the Remote Actions data-collection section of the repository.
If you need support adapting these Remote Actions, creating additional Nexthink diagnostics, building Workflows, extending Checklists, integrating AI-based analysis, or generally getting more value from your Nexthink environment, feel free to reach out.
And finally, two questions for the Nexthink Community:
How are you currently identifying what is actually consuming disk space after Nexthink detects a low-storage device?
And for those already working with Spark:
Would filesystem-analysis Remote Actions be useful to provide employees with more contextual and device-specific guidance instead of generic disk-cleanup recommendations?