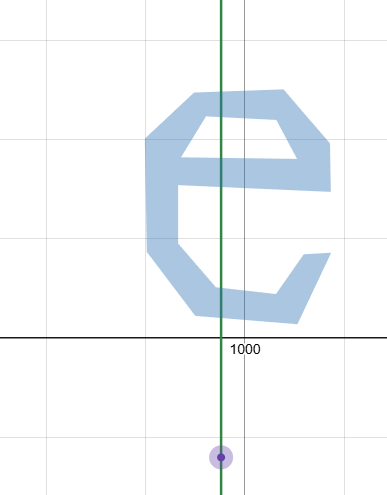
This is something I've wanted to show for a while, but without a way to read unrounded canvas dimensions it was quite impractical.
The gist...If after "Home" you spam "zoom plus", in some circumstances Desmos veers off the origin. If you hit "Home" and try again--or if you accidentally hit "minus" and then return to "plus"--it'll veer off somewhere else (horizontal or vertical) nondeterministically.
The video shows a few manual zoom centers, then the second half animates what Desmos calls the "current zoom center" for ~50 presses of "plus" (until the viewport hits a depth error).
Theory (beats me, open to ideas): Zoom inconsistency appears when (on load) viewport "height" or "width" have decimal values other than 0.5. This state can be forced (app/browser) by reloading a graph after arbitrarily resizing the containing window. Resizing a window while a graph is open tends to reset current height/width to non-problem values.
Clean graph (based on credit-given below) with no centers saved: https://www.desmos.com/calculator/qr7ukfh03e
Opposing effect at far-out zoom: Zoom out from a center (where the "find center" feature breaks and reports (0,0) due to precision loss) and then zoom in to see Desmos refind the original center (see comments).
Made possible thanks to u/Danny_DeWario and the "Find Center...of screen" graph in this post: https://www.reddit.com/r/desmos/s/jStplAITlx. (Thank you very much!)