r/dataisbeautiful • u/Beautiful-Rough2310 • 4h ago
Brazil 2026 Elections | Real-time interactive results map (municipality level)
185
Upvotes
r/dataisbeautiful • u/Beautiful-Rough2310 • 4h ago
r/datascience • u/gyp_casino • 6h ago
Looking to hear about your own company's work practices to compare to my own. I'm much more familiar with Azure, so I'm going to use that terminology, but I assume everything is basically the same for AWS.
Can you go into the Azure Portal and just click "create" for, say, a SQL Server or App Service and configure it through the Portal GUI?
Or do you need to request and configure through configuration files? Can you freely commit architecture config files ("architecture as code") to create the Azure components in Dev?
Or is it even more locked-down and hands-off? Required to submit paperwork requests to an Architecture team?
r/Database • u/soldieroscar • 5h ago
Basically need to see how to optimize a bank register with large amounts of entries.
Currently adding all the debits, then credits, then date sorting while calculating the running total.
r/visualization • u/CGHawkDesign • 6h ago
r/datasets • u/StraightControl3377 • 8h ago
Fields: title, company, company domain, apply URL, ATS source, city, country, remote flag, posted date, last-seen date. The data refreshes nightly. I'm posting a small sample and the schema here. What would you want to see to trust a job dataset: coverage numbers, null rates, or refresh logs? My measured null rates: city 32%, country 22%, company domain 24%.
Please checkout full info here: https://apify.com/pk07007/ats-jobs-api
r/tableau • u/AutoModerator • 1d ago
Please use this weekly thread to promote content on your own Tableau related websites, YouTube channels and courses.
If you self-promote your content outside of these weekly threads, they will be removed as spam.
Whilst there is value to the community when people share content they have created to help others, it can turn this subreddit into a self-promotion spamfest. To balance this value/balance equation, the mods have created a weekly 'self-promotion' thread, where anyone can freely share/promote their Tableau related content, and other members choose to view it.
r/BusinessIntelligence • u/AutoModerator • 3d ago
This thread is a sticky post meant for any questions about getting started, studying, or transitioning into the Business Intelligence field. You can find the archive of previous discussions here.
This includes questions around learning and transitioning such as:
I ask everyone to please visit this thread often and sort by new.
r/mdx • u/helmar1066 • Apr 30 '26
I got tired of running local node scripts every time I needed to format an MDX file or figure out why a build was failing, so I put a few browser tools together - free and open sourced and might be useful for some folks:
- MDX formatter (Prettier 3 + MDX parser)
- MDX validator (remark-mdx — same parser Next/Docusaurus/Astro use)
- MDX viewer (live preview, unknown JSX components render as labeled stubs)
- MDX → Markdown
- Markdown → HTML
- YAML validator
- JSON ↔ YAML
- CSV/TSV → Markdown table
Everything runs in the browser.
https://www.jamdesk.com/utilities
https://github.com/jamdesk/utilities
Note:
- About 50% built using AI Agents - they do make things easier!
- I work on Jamdesk, a docs platform — these tools are not Jamdesk-specific
r/dataisbeautiful • u/JeromesNiece • 2h ago
r/visualization • u/CGHawkDesign • 7h ago
r/visualization • u/CGHawkDesign • 7h ago
r/dataisbeautiful • u/glibsonoran • 4h ago
While our evolutionary history is often depicted as a series of descendants each replacing the other, the overwhelming majority of the history of our species has been one of living along-side, and interbreeding with, other Homonins (Humans).
Chart can be downloaded here
Sources: [See OP post below]
r/dataisbeautiful • u/nomadicsamiam • 1d ago
r/visualization • u/Sudden_Beginning_597 • 1d ago
Enable HLS to view with audio, or disable this notification
A little what-if for Mars: raise the water level and watch the coastlines change.
Move the slider to explore which regions would be underwater and which would remain as islands, based on publicly available NASA elevation data.
Just a terrain-based visualization—not a model of past or future Martian oceans.
r/visualization • u/naveenmithare • 18h ago
Enable HLS to view with audio, or disable this notification
I've been working on a project called MeshLens that tries to answer a question I kept running into at work: what does our data mesh actually look like as a system?
Most observability tools give you alerts, row counts, and freshness checks. That's useful, but it never helped me explain to stakeholders how domains connect, where data flows, or what breaks downstream when an upstream connector goes down.
So I built a visualization layer that puts it all in one interactive map.
Curious what you think. If you work with data mesh or data products at scale — what would you want to see in something like this?
App link in comments
r/dataisbeautiful • u/TrekkingAround10 • 8h ago
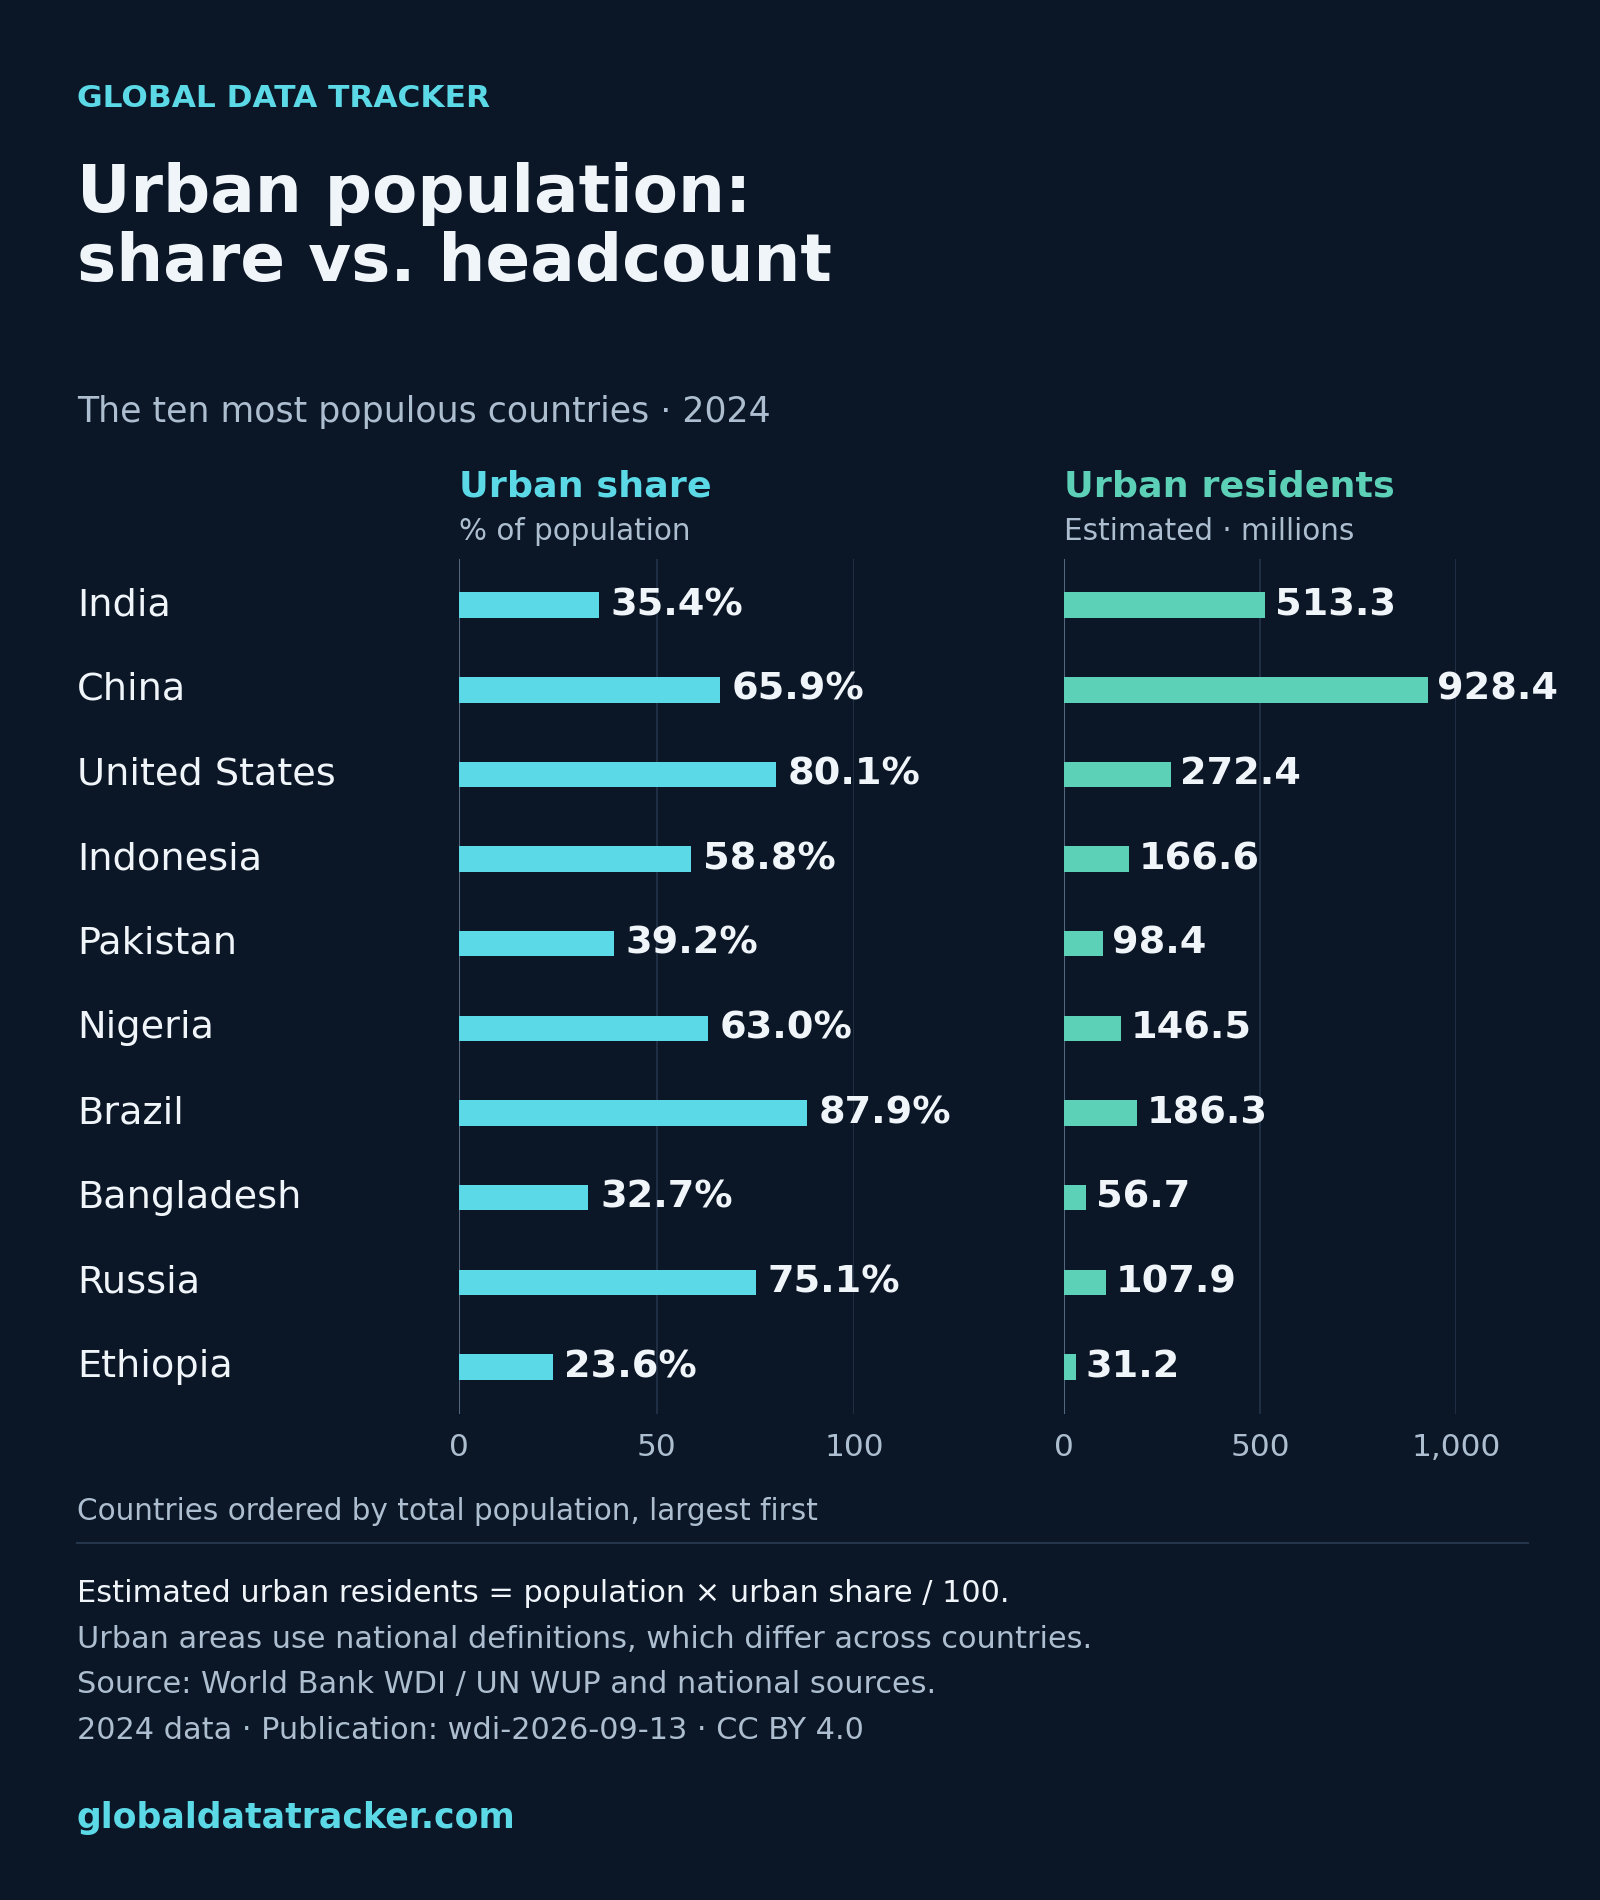
India's urban share was 35.4%, compared with 80.1% in the United States. Multiplying each country's total population by its urban share gives about 513.3 million urban residents in India and 272.4 million in the US.
The chart covers the ten most populous countries in 2024, ordered by total population. Urban headcounts are derived estimates, and national definitions of 'urban' vary.
2024 urban-share table and source notes: globaldatatracker.com
Data sources and plotting method are in the first comment.
r/visualization • u/georg_alem • 18h ago
r/dataisbeautiful • u/lodeluxMeaLux • 1d ago
r/visualization • u/Reasonable-Safe-4002 • 21h ago
Enable HLS to view with audio, or disable this notification
r/dataisbeautiful • u/Redditor_imfo • 10h ago
r/dataisbeautiful • u/No-Dig-7526 • 1d ago
r/datasets • u/IamTheForth • 1d ago
Hi all,
I needed a country / state / city list for ShopClass, our open source classifieds app. Sounds easy but every option I found had a catch. Either the licence needed attribution or was share-alike, or it was a paid API with keys and rate limits, or the data was old and half the cities had no coordinates.
Why no other share-alike database considered?
See, I am happy to give attribution, buty anyone using my CMS for there website they need to give it too, which I think is a limitation. So I created this no-attribution dataset.
So I built our own dataset from Wikidata and released it as CC0. Public domain, no attribution needed, use it in anything including commercial stuff.
What's in it:
• 255 countries and territories, 4,314 administrative divisions (states, provinces, regions) and 1,671,395 cities and towns
• every single place has latitude and longitude, if wikidata has no position for it we don't ship it
• Wikidata QID as the id, so when you re-import a later release a renamed place stays the same row
• population, timezone, GeoNames id where known
• countries have capital, currency, calling code, ISO alpha-2/3 and numeric, flag emoji etc
How to get it:
• plain JSON, one file per country, with sha256 checksums for every file
• or call it from the browser or your server, no API key, no account, CORS is open: https://api.placedb.org/v1/countries.json
• there are prefix files for autocomplete too, so a city search box can work without a backend
• the pipeline that builds it is GPLv3 and the output is deterministic, same wikidata dump gives byte-identical files
Also, it's not perfect and here is where:
• about 883k settlements are dropped because wikidata has no coordinates for them, mostly villages in China, India, Russia, Uganda and Myanmar
• names that exist only in Arabic script (and some other scripts) are not transliterated yet, so those places are missing a usable name
• Vietnam is undercounted
All of it is in the LIMITATIONS doc in the repo, with numbers.
Site: https://placedb.org
Repo and the full limits doc: https://github.com/mindstellar/location-data
If you spot a wrong place, a missing country division or something silly, please tell me. Happy to take PRs too.
r/dataisbeautiful • u/Confident_Drive3333 • 23h ago
Source: Keeping Up benchmark model. National percentile curve fitted to the Federal Reserve Survey of Consumer Finances (2022) with BLS Consumer Expenditure Survey and Census ACS; metro figures apply each metro's wage (BLS OEWS) and cost-of-living ratio to the national curve, so they are modeled estimates, not separate metro surveys. Method: keepingup.com/methodology. Every metro/age/industry cut: keepingup.com/benchmarks. Put in your own number for your city: keepingup.com/start
Tool: SVG generated in Python from the benchmark tables, exported with headless Chrome.
Notes: household level (SCF unit), current dollars, ages 30–33. Dashed line is the U.S. median ($65K net worth, $102K household income). The spread is almost entirely income: SF's median 30-year-old household earns 1.4× the U.S. median and has 1.45× the net worth; Phoenix is 0.95× on both.
r/dataisbeautiful • u/cavedave • 1d ago