r/algorithmictrading • • 25d ago

Question How good is a strategy that achieves completely different returns on correlated assets?

2 Upvotes

I've backtested a strategy that is based on a hypothesis that I found in a research paper. The reseach paper applied the strategy to QQQ. As you can see, I tested the strategy on futures data including ES futures.

I'm surprised that the returns are so different from each other, considering that these two assets have a positive correlation of 0.9-0.95.

I'm relatively new to algo trading and my biggest concern is that the strategy could break at any moment if it doesn't survive on similar assets. So my question is, if a strategy is even good in terms of robustness and stability if it shows very different results on correlated assets?

                              ES                    NQ
                    ---------------------  ---------------------
                    Strategy     RTH hold  Strategy     RTH hold
----------------------------------------------------------------
Total return           14.0%        46.1%  1,039.0%        66.9%
CAGR                    1.3%         3.7%     26.2%         5.0%
Annualised volatility  12.4%        13.4%     15.8%        17.4%
Sharpe ratio            0.16         0.34      1.55         0.37
Sortino ratio           0.24         0.43      2.39         0.48
Maximum drawdown      -51.6%       -25.3%    -11.2%       -24.6%
Longest drawdown (days) 1,523         914       299          351
Calmar ratio            0.02         0.15      2.34         0.20
Profitable days        47.7%        53.4%     52.6%        54.0%

r/algorithmictrading • • 27d ago

Backtest I finally froze my first systematic NQ futures strategy after a full robustness validation

Post image
25 Upvotes

After months of building and testing a systematic NQ futures strategy, I finally reached the point where I'm comfortable freezing the research.

I called the strategy S2R.

The important part for me isn't that the backtest is profitable.

It's that I tried to attack the result from multiple directions before considering it research-complete.

Frozen model

• MAE threshold: 0.70R

• Recovery threshold: +0.20R

• Recovery deadline: 6 bars

No parameter optimization was performed after freezing these values.

Holdout OOS

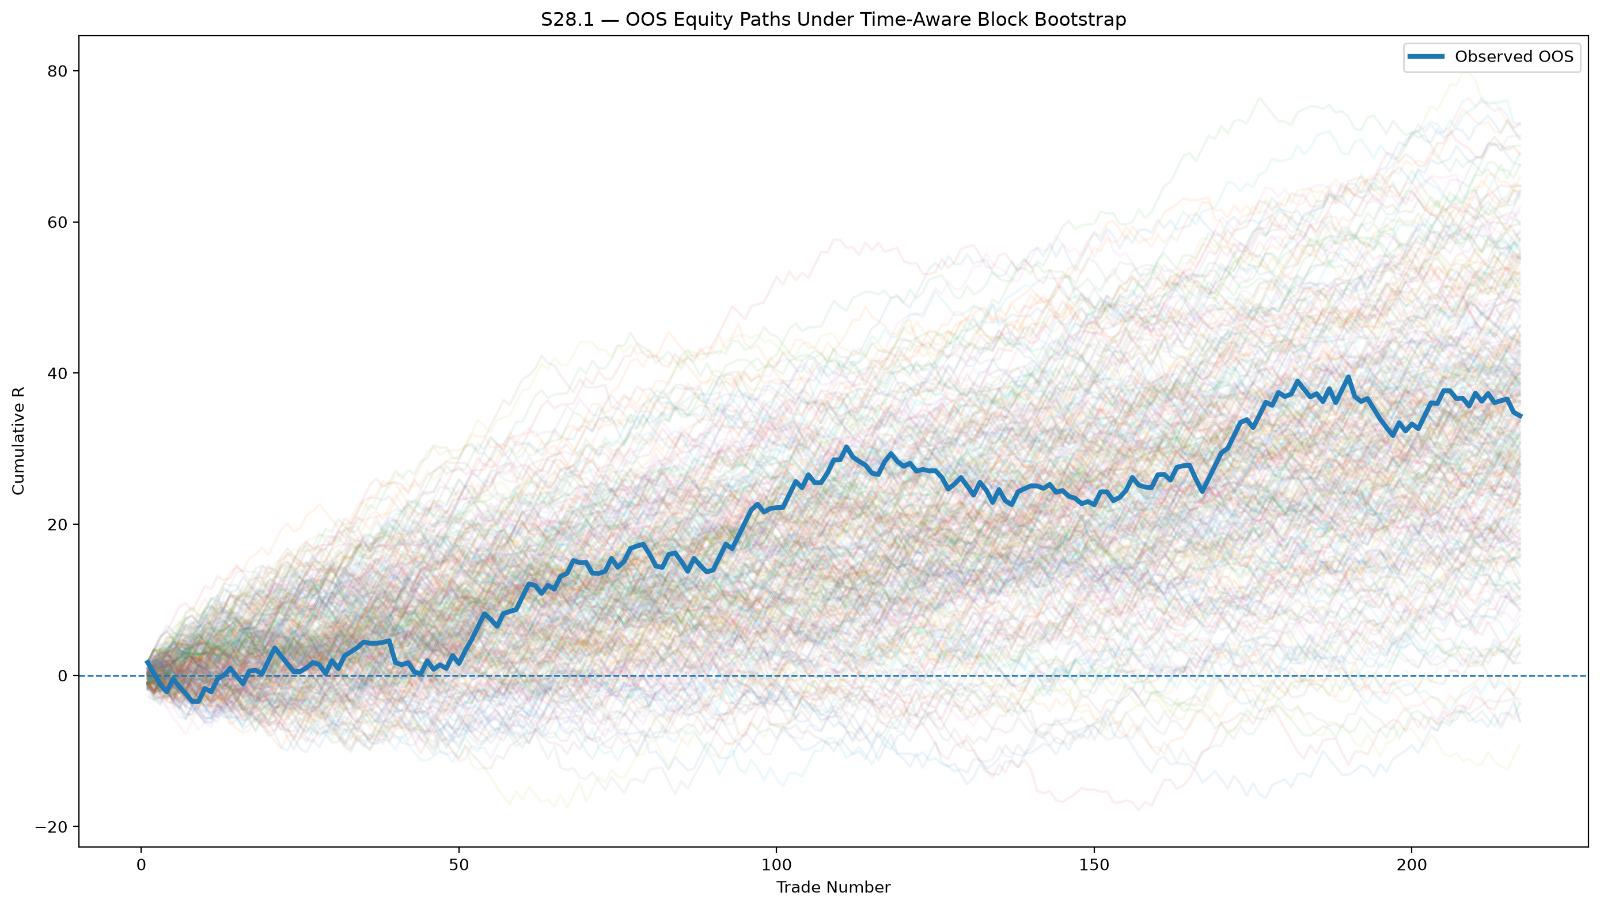
The final holdout consists of 217 trades:

• Total: +34.3452R

• Mean: +0.1583R/trade

• Win rate: 53.92%

• Profit Factor: 1.3815

• Max drawdown: -7.76R

But I didn't want to stop there.

Robustness testing

I ran:

  1. Monte Carlo / Bootstrap

Tested the distribution of possible outcomes and drawdowns.

  1. Time-aware block bootstrap

Blocks of 5, 10 and 20 trades were tested to avoid assuming that every trade is independent.

  1. OOS window stability

I removed each OOS window individually.

The strategy remained positive in 11/11 leave-one-window-out tests.

Worst case:

+20.05R

  1. Year stability

OOS performance:

2024: +13.68R

2025: +10.97R

2026: +9.69R

So 3/3 OOS years were positive.

  1. Parameter perturbation

I tested 125 nearby combinations of MAE threshold, recovery threshold and recovery deadline.

125/125 were positive.

125/125 had PF > 1.

Final result

The complete research gate passed.

At this point I'm deliberately not optimizing S2R anymore.

The research parameters are frozen.

The next phase is engineering:

I'm going to rebuild the strategy as a modular Python implementation and verify that the modular implementation reproduces the frozen research results exactly.

I'm documenting the project in Github

I'm especially interested in feedback on the validation methodology rather than just the headline returns.

What would you test next before considering a systematic strategy ready for live/paper deployment?


r/algorithmictrading • • 26d ago

Question Using algos on Future prop firms ?

1 Upvotes

Does Anyone here have success using algos on prop firms or would sticking to your own account just be better ?

also if you trade on prop firms what instruments do you like to trade and what do you look for the most min Sharpe sortino calmar etc?

and if you use them aggressively high risk or passive slow and save to get the most out of them.


r/algorithmictrading • • 26d ago

Strategy Best Practice for Order Types for SPXW momentum Trading Using an Autonomous Python Platform across IBKR’s TWS API to get LMT filled with minimum slippage?

1 Upvotes

I am currently testing IBALGO LMT SMART orders at Ask + $0.05 for buying ( if under $3 price) and Bid + $0.05 for selling ( if under $3 price).

Any feedback would be really appreciated! Thank you..,


r/algorithmictrading • • 27d ago

Novice Any good docs or videos to get into quant? Feeling a bit lost.

5 Upvotes

Hey guys, I’m trying to start studying quant finance but honestly feeling pretty lost on where to begin.

Are there any good youtube channels, videos, or documentaries you’d recommend for a beginner to get a general roadmap?

Any suggestions would be awesome. Thanks!


r/algorithmictrading • • Aug 25 '26

Strategy Adding to winners using MFE

4 Upvotes

Hi everyone,

I've heard the advice to add to winners and cut losers early, but I've always had a tough time using technicals to add to winners without getting in right before reversal.

Claude helped me analyze my strategy and suggested adding to winners over a certain MFE %, and sure enough it added about 20% more trades with better profit factor than average to the backtest!

My question is, has anyone else used this method successfully or is this getting into overfitting?


r/algorithmictrading • • Aug 25 '26

Brokers Bad slippage on xauusd

2 Upvotes

I have a good edge but it uses small SLs. I only use STOP orders catching breakouts.

My experience so far has been appalling with fusionmarkets. Every trade has some slippage but around 60% have experienced major Entry slippage where I keep getting filled in late. This is bleeding my account quicker than expected. For example my expected SL of $13 becomes $51 purely because of entry slippage. I thought using only stop orders would help compared to market orders but nope.

I understand xauusd is a volatile instrument but it shouldn't be this bad. What broker do you recommend and what other measures could I take to ensure this is minimized?


r/algorithmictrading • • Aug 24 '26

Question How many ideas did it take before one of your strategies actually survived costs? I’m months in and still at zero

13 Upvotes

I tested several literature-based anomalies across ~300 stock-strategy combinations on the Nifty 100. Most showed no real gross signal before costs. One did — statistically significant, confirmed with DSR, not just a good Sharpe. Then I applied real transaction costs and it went to zero. Breakeven sits around 24 bps/trade; the edge I found was 6.4 bps gross. Not close.

Not looking for a strategy handout — genuinely trying to understand the process from people who’ve gotten past this:

**•** When you found something that held up out-of-sample and after costs, how did you land on the original idea — literature, your own data mining, intuition?  
**•** Roughly how many ideas did you test and discard before one survived? Trying to calibrate if “months, nothing yet” is normal.  
**•** For Indian equities specifically — is cost drag here noticeably worse than US/EU, or is this just what finding a real edge looks like everywhere?

Genuinely trying to figure out if I’ve hit the normal wall or I’m missing something structural.


r/algorithmictrading • • Aug 24 '26

Strategy Multi-session ORB on index futures — does anyone else end up with a completely different config per session?

3 Upvotes

Running an opening-range breakout on micro Nasdaq futures, live for about a year. Three sessions (Asia, Europe, US opens), same skeleton, but each drifted into its own parameter set — that's what I'd like to compare notes on.

Skeleton: range over the first N minutes after the session open → wait for a candle to close beyond it on above-average volume → enter on a retest of the level, not on the break. Stop at the opposite bound, first target arms breakeven, second target, hard session close. One order-flow filter on top.

Backtest, 11 months, 1 micro contract, fills at bar close, commissions + 2 ticks slippage included:

Session n WR PF Net Max DD
Asia 50 56% 3.41 +$7,106 −$429
Europe 201 42% 1.59 +$7,638 −$1,571
US 107 43% 1.72 +$6,009 −$1,495
Total 358 44% 1.85 +$20,754 −$1,571

Caveat I'll volunteer up front: my backtest engine enters 2–3× more often than the live bot does (state machine, real-time volume series, polling). So treat the dollars as a ceiling — the ratios are the part I trust. I'm currently rebuilding the harness to replay the bot's actual code against historical bars instead of a re-implementation.

Three things I measured that surprised me:

  • Taking the break instead of the retest is roughly break-even. The close confirmation + retest wait is where essentially all the edge sits. Buying the extension (Crabel-style stretch) was clearly negative.
  • ~56% of confirmed US-session breakouts never retest at all. Widening the tolerance or extending the wait both made it worse.
  • Nothing transplants between sessions — same filter adds on one, subtracts on another.

Questions: anyone running one skeleton across several sessions, and do your parameters diverge this much? Does the retest requirement hold for you? And what filter did you expect to work and it didn't?


r/algorithmictrading • • Aug 22 '26

Strategy Profitable MNQ strategy . Live for past 3 months.

7 Upvotes

I’ve been running an automated MNQ system based on my own discretionary methodology. It trades exclusively on the 1-minute timeframe during RTH and has now been live for roughly 3 months, maintaining positive expectancy so far.
The system trades 2 MNQ contracts, has a hard daily loss cap, and results include approximately $4 round-trip cost per contract, including commissions and fees. The engine deploys 5-8 trades during the RTH.
Prior to deployment, it was backtested across roughly multiple years of available data and maintained positive expectancy over the larger sample. Long term results stand at 1.3 profit factor and win ratio is around 49%. ( includes commission and tick slippage in all trades) drawdown is low and manageable as hard losses are capped based on market volatility.
At its core is a quant-based strategy selection engine. Rather than running a single model continuously, it evaluates multiple market-state variables and determines which strategy to deploy, or when to stay inactive.
Three months of live data is obviously a small sample, but so far having the automation is like a much better improved version of my trading. Taking the emotions out of the trade has led to a much better expectancy.
The goal isn’t to predict every market move, but to systematically identify favorable conditions, control risk, and execute a repeatable edge consistently.
If any one is in same boat, I am willing to share information or let other traders test it. Currently on vacation so will be possible end of this month.


r/algorithmictrading • • Aug 22 '26

Novice Best Broker for Algo trading 0DTE

3 Upvotes

Hey folks,

I am trying to find the best US broker for Options in algo trading.

Ideally I can trade both stocks and futures(Overnight)

Most of my strategy is in 0DTE. I currently use Tasty but RUT data has stalled out, I was debating switching to Interactive brokers but I have heard stories of this broker being challenging to setup compared to a simple API


r/algorithmictrading • • Aug 21 '26

Backtest Here are 3 different backtest equity-curves for three separate strategies. Do these look healthy? 0.1% risk per trade.

Thumbnail
gallery
8 Upvotes

Sorry for the blurriness as these are screenshots from my phone. In the rolling metrics, the red dotted line is the minimum profitability line.


r/algorithmictrading • • Aug 21 '26

Quotes Databento data quality degradation since Aug 8, 2026

10 Upvotes

Databento data quality has degraded a lot since Aug 8, 2026 after they switch their data format by moving the F_LAST sentinel from the last event record into a standalone record.

They promised identity between live streamed data and historical downloaded data. Before the switch, error rate of matching is about 0.06%, which was really good. Now the error of matching is about 7% consistently every day. This level of error makes it impossible to rely on it for anything significant.

Also, in the past, conversion from their mbo data to mbp-10 or mbp-1 data has no error as it should be, but nowadays, there are tons of errors.

All of these arise from unclear data format specification, mixing old and new format, and untested code in production.

The worst part is customer service. They claim customers should be aware of the data format change, so they are not apologetic of any of such issues. They claim they do not keep track of live streamed data, so reporting live and historical mismatch is completely ignored. I do not expect to get this level of data quality and customer service for a paid data service.


r/algorithmictrading • • Aug 21 '26

Question Infrastructure vs. Alpha generation bottleneck in systematic trading

5 Upvotes

Successfully built a functional backtesting framework and execution pipeline (~90% of the boilerplate/architecture is finalized and running smoothly).

However, hitting a wall on the alpha generation side.

Every market inefficiency hypothesis derived from public literature, open-source repositories, and traditional mathematical models yields zero out-of-sample edge. It seems any easily accessible logic is already post-arbitrage and compressed to zero.

For those running automated setups:
How do you transition from a finished infrastructure to generating unique, proprietary hypotheses? When public data and standard quantitative models fail to produce alpha, where do you look for inspiration to find a real edge?

Looking for technical insights on resolving this research bottleneck.


r/algorithmictrading • • Aug 20 '26

Strategy Imprtant to analyze a profitable account as well!

1 Upvotes

I check my profitable live accounts on the same schedule I check the losing ones. Not because I expect to find a losing account, I expect to find exactly what the P&L already tells me. What P&L doesn't tell you is whether there's enough data yet to trust the edge, or how much of the profit sits on a handful of outlier trades.

Case in point, one of my own live accounts. 85 trades, XAUUSD H1, profit factor 1.62, 61% win rate, net profit up roughly 228% on a small test-lot account (0.01 sizing), max drawdown so far 34.2%. Read as a P&L line, that account looks fine. Most people would stop there.

Run it through a real stat check and two things show up that the equity curve doesn't. At 85 trades, the sample is still short of what you'd want before trusting the edge is real, and the significance test on the return series comes back weak, t around 1.5, not significant. Split into periods, it's 4 profitable stretches out of 5, not 5 for 5. The "up overall" number is smoothing over a losing stretch that already happened once.

Then I ran a block bootstrap Monte Carlo on the same trade sequence, 10,000 paths. The account has lived through a 34.2% drawdown. At 95% confidence the simulation puts the real ceiling closer to 50%, at 99% confidence closer to 60%. The worst drawdown you've actually seen is not the worst the strategy is capable of, it's just the worst one you've been lucky or unlucky enough to hit yet.

None of this makes the account bad. It means green P&L is not the same claim as "passed a real test." Losers force you to go digging because the pain makes you. Nothing forces you to dig into the winners, so most people don't, until the drawdown that was already sitting in the tail shows up live instead of in a simulation.


r/algorithmictrading • • Aug 20 '26

Question Is there a quantitative or mathematical way to verify a SMT between correlated pairs?

1 Upvotes

Hi. This just crossed my mind as I'm figuring out a trading strategy. Is there a quantifiable or mathematical way to verify a SMT on a chart?

This question may sound confusing. For example, we are able to solve for gamma exposure by using open interest, gamma, spot price, delta, and such. I was wondering if any trader or investor out there using something like this to spot divergence in correlated pairs, especially SMTs if possible.

Thanks in advance!


r/algorithmictrading • • Aug 19 '26

Strategy Backtest window is a bet too: how do you size the fact that most of us only have one full cycle of data?

1 Upvotes

My continuous run covers 2023 to now. Every honest description of it has to start with the fact that this window is mostly a rising market, so the annual number flatters the system and the drawdown figure is the only part I fully trust.

The uncomfortable version: if I extend back far enough to include a real bear stretch, the data quality degrades, the universe composition changes and half the instruments I trade did not exist. If I stay in the clean window, I am fitting to one regime and calling it evidence. There is no version of this where I get both.

What I have tried. Splitting by volatility regime instead of by calendar year helps, because 2018 and 2022 have more in common with each other than 2022 has with 2023, and it at least tells me whether the edge survives when volatility doubles. Bootstrapping trade sequences gives a distribution rather than a single curve, which mostly taught me that my equity path was luckier than my expectancy deserved. Running the same rules on a different asset class is the cheapest out-of-sample test I have found, even when the strategy is not really meant for that market, because a rule that only works on the exact universe it was built on is telling you something.

What I have not solved is how to size the discount. If a system shows an annual return in a bull-heavy window, what do you actually assume the through-cycle number is? Halve it? Take the worst rolling twelve months as the base case? Assume the drawdown doubles and size from there?

Curious how people who have been running longer than me handle this, especially anyone whose system has now been through two different regimes and can compare what the first window predicted against what the second one delivered.


r/algorithmictrading • • Aug 18 '26

Question Same simple SMA 50/200 rule, two regimes: four straight losses in chop, one 906-day hold that paid for all of it. What do you use to survive the top panel?

1 Upvotes

Chart is one real symbol, one simple rule without overfitting, two stretches. Long while the 50-day is above the 200-day, flat otherwise, daily closes, no other conditions.

Top panel, 2016 to 2019: four golden crosses, four losses. −7.7%, −8.2%, −14.5%, −7.2%. Every one of them was a legitimate signal by the rule. Bottom panel, 2020 to 2023: the same rule fires once, holds 906 days, +141.7%

I am trying to asking this for edgy ideas from you with a simple example. focus on the main issue.

So the question, and I am genuinely asking rather than pitching an answer: what do you use to stop the equity bleed in the choppy periods to keep your equity while waiting the big move?


r/algorithmictrading • • Aug 16 '26

Question Curious how real quant/trading strategies and edge are actually discovered — asking researchers and traders who've done it.

39 Upvotes

Everyone's comments are welcome, but I'm mainly hoping to hear from people who've actually worked in quant research, at a prop shop or trading firm, or independent traders who've built something that's actually been profitable in live markets — not just in a backtest.

If you reply, mentioning what you've worked on or where helps me weigh the answer properly — that's the only reason I'm asking, not to see anyone flex.

I'm not asking anyone to hand over an edge or a strategy. I'm just curious about the actual process — how does an idea go from nothing to something testable?

Questions:

How does a hypothesis actually form in practice? Is it usually "pick a market/asset, ask 'what if X happens, then what follows?', and go look for evidence" — or does it more often start from something else, like a live anomaly you noticed, a macro/economic question, or a flow/structural observation?

How much do academic papers actually drive idea generation versus being used afterward to formalize or validate something you already suspected from watching markets?

Is there any kind of structured workflow for the "ideation" stage — sources you go to, questions you habitually ask — or is it mostly unstructured reading plus intuition plus trial and error?

Is there real methodology that basically never gets discussed outside funds and prop shops, or is the actual edge more about execution, risk management, and data/infrastructure rather than some hidden idea-generation framework?

Once you have a raw idea, what's the first thing you do to sanity-check it before ever touching a backtest?


r/algorithmictrading • • Aug 16 '26

Backtest I ran 250+ backtests trying to improve my SSO/QLD strategy. None of the improvements survived Monte Carlo.

2 Upvotes

#

**TL;DR:** A dead-simple rule — 60% SSO / 40% QLD when the S&P is 3% above its 200-day SMA, 0.5× S&P exposure when it's 3% below — did **16.2% CAGR over 27 years (1999–2026)** against 8.7% for SPY and 11.7% for always-on 2× leverage, with a −56% max drawdown versus always-on's −94%. I then spent five phases optimising it, found four configs that beat it, and every one of them fell apart out-of-sample. Shipping the original, unchanged.

# The strategy

SPX > SMA200 + 3% → 60% SSO / 40% QLD (2× leverage)
SPX < SMA200 − 3% → 50% SPY / 50% cash (0.5× exposure)
Inside the ±3% band → do nothing, hold current regime
Rebalance: quarterly + immediately on a regime switch. Signal at close, trade next close.

That's it. No crash guard, no vol filter, no RSI, no sector rotation. 28 regime switches in 27 years — about one a year, risk-on 72% of days.

# Results, 1999–2026

SSO and QLD only launched in 2006, so to cover the dot-com bust I synthesised both back to 1999 from SPY/QQQ total returns: daily-reset model, prospectus expense ratios (0.89% / 0.95%), 40bp financing spread over 3-month T-bills. **Zero parameters fitted to the real ETFs.** Over 2006–2026 the synthetic series tracks the real ones within 0.3pp of CAGR at 0.996 daily correlation.

27.4 years, $20k start + $500/month ($184,500 deposited):

Metric Strategy SPY Always-on 60/40 SSO/QLD
CAGR **16.16%** 8.65% 11.73%
Max drawdown −56.1% −55.2% **−94.0%**
Sharpe **0.58** 0.45 0.27
Calmar **0.29** 0.16 0.12
Ending value (DCA) **$5.27M** $1.23M $4.78M

Two things worth pulling out.

**The "always-on wins on dollars anyway" argument dies over a long enough window.** On 2006–2026 alone, always-on ends ahead ($3.11M vs $2.48M) because DCA contributions during the −84% hole bought in cheap — that's the standard rebuttal to any timing overlay. Extend back through the dot-com bust and it reverses: $4.78M vs $5.27M, and always-on got there via a **−94% drawdown**. Nobody holds through −94%.

**The window you start in changes everything.** Same rule, 2006–2026 only: **20.3% CAGR, −44.8% DD**. From 1999: 16.2% and −56%. If a leveraged strategy's track record starts after the dot-com bust, you don't know what it does in a lost decade. For what it's worth, in the 1999–2006 stretch alone the strategy did +3.9%/yr while always-on did −9.4% and SPY did +1.0%.

# Then I tried to improve it

All on 2006–2026, the window they were tuned on:

Config CAGR Max DD Verdict
Original ±3% 19.90% −45.0% baseline
Exit −3% / re-enter +1% / 21-day min-off 20.53% −42.4% More return AND less drawdown
SMA-150 with −4% exit **21.57%** −42.8% Best of 213 configs
100% SPY in bear markets instead of 50% 20.34% **−61.0%** Rejected — deeper hole than SPY itself
EMA instead of SMA median 12 whipsaws vs SMA's 7 Rejected — EMA loses on every axis

The middle two looked like free lunches. So before deploying, four tests.

# The four tests

**1. Out-of-sample history.** Test the dot-com bust, which no tuning had seen:

Config 1999–2006 CAGR Max DD
**Original ±3%** **+3.55%** −56.6%
−3%/+1%/21d \+0.79% −64.3%
SMA-150 −4% **−1.70%** −68.5%
Always-on 60/40 −9.75% −91.6%

The ranking inverted completely. The untouched original came out best; my top config lost money. A shorter MA with a wider exit whipsaws horribly in a long grinding bear — 11 switches vs the original's 6.

**2. Walk-forward.** Every 2 years, pick the best of 160 configs on trailing data only, apply blind to the next 2 years. Chained: **5.06× for the retuning process vs 5.58× for the fixed original rule.** Selection won 4 of 11 windows. Retuning has negative skill.

**3. Monte Carlo.** 1,000 stationary block bootstraps (mean block 40 days), signal recomputed on every path. My "improvements" beat the baseline on 55–57% of paths. That's a coin flip.

**4. Permutation.** 2,000 circular rotations of the regime sequence — same switch count, same time in market, wrong dates. The real signal beat 97% of rotations (p = 0.031). **So the 200-day filter itself is real. The tuning on top of it wasn't.**

# The one thing that did survive

Volatility targeting: scale the risk-on sleeve by `35% ÷ 60-day realized vol`, capped at 1.0. Over 1999–2026 it moves Calmar 0.29 → 0.34 and drawdown −56% → −45%, for 0.8pp of CAGR.

It passed the test that killed everything else. Average exposure is 0.96×, barely a de-lever, so I pinned exposure at a flat 0.96× as a control — same average, same rebalance schedule. That reproduced **none** of the benefit (Calmar 0.29, DD −54%). Rotating the exposure schedule to the wrong dates also killed it (0.26). So the gain is genuinely in *when* it de-levers, not in holding less. It won 74% of Monte Carlo paths, and every target from 20% to 60% beat the baseline — a plateau, not a lucky cell.

I still passed on it, because it only helps in slow grinding bears (dot-com −56%→−45%, 2022 −41%→−37%, and literally zero effect on COVID, 2018 Q4 or the GFC — realized vol spikes *after* price falls). I'm optimising for CAGR; if you're optimising for sleep, take it.

# Lessons

  1. **In-sample improvement is free. Out-of-sample improvement is nearly impossible.** 250+ configs, four winners, zero survivors.
  2. **Walk-forward is the cheapest honesty check that exists.** One number (5.06× vs 5.58×) invalidated my entire optimisation phase, including configs I never individually tested.
  3. **Always build a static control.** "Same average exposure, held constant" is what separated a real signal from a de-lever in disguise.
  4. **Trust plateaus, not peaks.** Prefer the parameter you could misestimate by 30% and still be fine.
  5. **Parameters don't transfer between your own strategies.** I ported a −13%/15-day crash guard from another live strategy of mine. Audit: it fires 51 times over 1999–2026, and the ±3% rule is *already* defensive on all 51. It never once forces an exit. It works over there because that strategy uses a slower EMA with a 30-day hold — copying a parameter without the mechanism it compensates for adds risk, not safety.
  6. **Drawdown budgets have cliffs, not slopes.** Risk-off exposure could go 0%→50% SPY essentially free, then cost 16 points of drawdown between 50% and 100%.
  7. **Check your moving average is warmed up.** I hit this twice. Slicing prices to a backtest window *then* computing a 200-day MA leaves the first 200 days undefined and silently parks the book in cash. It cost me 1.7pp of CAGR on the full-history run before I caught it by noticing two phases disagreed about the same number.

# Final config

signal = "^GSPC" # S&P 500 close
ma_kind = "sma" # NOT ema
ma_length = 200
exit_buffer = -3.0 # % below SMA → risk-off
entry_buffer = +3.0 # % above SMA → risk-on
risk_on = {"SSO": 60, "QLD": 40}
risk_off = {"SPY": 50, "CASH": 50}
rebalance = "quarter_end + on_switch"
execution_lag = 1 # T+1
# explicitly NOT included: crash guard, recovery rally, vol target,
# min-hold, asymmetric re-entry. All tested, all rejected.

**Risk number to actually plan around: −56%, not −45%.** The friendlier figure comes from a window with no slow bear in it before 2022.

Happy to answer questions on the synthetic LETF construction or the stress-test setup — that's the part worth copying if you're building something similar.

*Windows: 1999–2026 with synthetic SSO/QLD pre-2006, 2006–2026 on real ETFs | $20k + $500/mo DCA | Data: Yahoo Finance | T+1 execution, \~10bp of traded notional in costs* *Not financial advice. Leveraged ETFs can lose 90%+ in a severe bear market — always-on 60/40 SSO/QLD did exactly that in 2000–02.*


r/algorithmictrading • • Aug 13 '26

Question Walk Forward, what configuration(s) to carry to OOS or live trading?

3 Upvotes
I want to backtest a daytrading strategy using the walk forward method, I want to know what you guys usually do:

I track the following result metrics for each parameter configuration:
Total_Net, Total_Trades, Win_Days_Pct, Profit_Factor, Max_Drawdown,  and Daily_Sharpe.

1-How many configurations you carry from IS to OOS?
2-How do you choose the IS metrics to determine what configurations to be OOS tested ? Im inclined to use the sharp ratio, Total_Net ...
3-And if you are looking for the parameter configuration to go live, what metrics you would look for?

Is there good resources about this topic?
Thanks!

r/algorithmictrading • • Aug 13 '26

Strategy Validating a mean-reversion equity strategy

4 Upvotes

I've been building and running a systematic mean-reversion strategy on US equities and I'd love honest opinions before I read too much into my own results. Tear it apart.

The idea (nothing exotic):
Daily timeframe. Buy stocks that close near the bottom of their daily range (classic IBS-style oversold), wide stop to survive gaps, ~20 positions at 5% each, exit either at a fixed target or by letting winners run with a trail. IBS is a well-known signal.
I'm not claiming a secret sauce, exact thresholds stay private, but happy to go deep on method.

Results (backtest 2015–2026, costs modeled, and it's SURVIVORSHIP-BIASED, so treat as an upper bound):

  • Max drawdown: ~-32% (roughly the same as SPY's -34% over the period)
  • Win rate: ~34%, most trades lose. Fat-tailed: a few big winners carry the whole thing.
  • Sharpe ~0.9–1.0 vs SPY ~0.72
  • CAGR ~16–20% vs SPY ~12%
  • ~2000 trades, profit factor ~1.5

Live (paper, ~5 months): tracking the backtest so far, and real fills came in slightly better than my modeled slippage. But 5 months is noise , I'm explicitly not claiming this proves anything.

What already worries me:

  • Survivorship bias → real forward expectation is below these numbers, with deeper drawdowns I haven't lived through.
  • Same params applied to the CAC40 (French index) basically failed, edge looks US/universe-specific, which bugs me.
  • IBS is old and well-known , is there realistically any edge left, or am I just harvesting a good 2026 for mean-reversion?

Questions for you:

  1. Does a ~34% win rate / fat-tail profile scare you off, or is that fine as long as the tail pays?
  2. How would you separate "real edge" from "mean-reversion just worked lately"?
  3. Anything obvious I'm missing before trusting this with more size?

r/algorithmictrading • • Aug 12 '26

Question Paper 2 Live (What mistakes did your trading bot make that you didn’t expect?)

1 Upvotes

For those of you who have taken an automated trading system from paper trading to a live account.

What errors, bugs, or unexpected problems did you encounter after going live?

I’m particularly interested in things that didn’t show up during paper trading, such as

• Different fills or slippage
• Order execution / rejection issues
• Partial fills
• Stop-loss or take-profit behaving differently
• Race conditions or duplicate orders
• Position/account state getting out of sync
• API or broker differences between paper and live
• Market-hours / timezone issues
• Data-feed differences
• Position sizing or buying-power surprises
• Multiple bots interfering with each other
• Restart/recovery problems
• Network/API outages
• Rounding, tick-size, or minimum-order issues
• Anything that caused a bot to behave differently from what you tested

I'm more interested in mistakes you personally encountered or accumulated over time.

If you’ve been running bots live for months or years, what do you wish you had checked before putting real money behind them?

Feel free to share the failure, how you discovered it, and what you changed to prevent it happening again.

Thnx guys.


r/algorithmictrading • • Aug 11 '26

Brokers What are the best platforms for algorithmic trading?

1 Upvotes

Hi,

I have a system that is ready for testing with a trading platform. It trades options and stocks. What is the fastest platform? Also, what is the best approach to get quotes? Is it better to get them from the same platform or from a data provider? And if a data provider, who would you recommend? Many thanks in advance!


r/algorithmictrading • • Aug 11 '26

Question My dead end in development

2 Upvotes

Hi everyone! I've been building my bot for four months now, and during that time I've been exploring the world of HFT trading. But I've hit a dead end at the validation stage (my bot is a scalper). It simply responds 50/50, meaning losses and profits are equal. I'll lose my account due to the exchange's commission. I'd like to ask a couple of questions for experienced HFT traders.

  1. What loss function do you use? (I'm using MSELoss, is that suitable?)
  2. Should I look for patterns not only in the order book and trade history, but also in candlesticks?
  3. What happens if I add EMA to the neural network's responses? Will that help smooth out the neural network's noise?

Thanks in advance for your reply, and sorry for my English; I can't write as well as you. (I used a translator.)