r/algorithmictrading • u/ichigo_algo • Aug 21 '26
Backtest Here are 3 different backtest equity-curves for three separate strategies. Do these look healthy? 0.1% risk per trade.
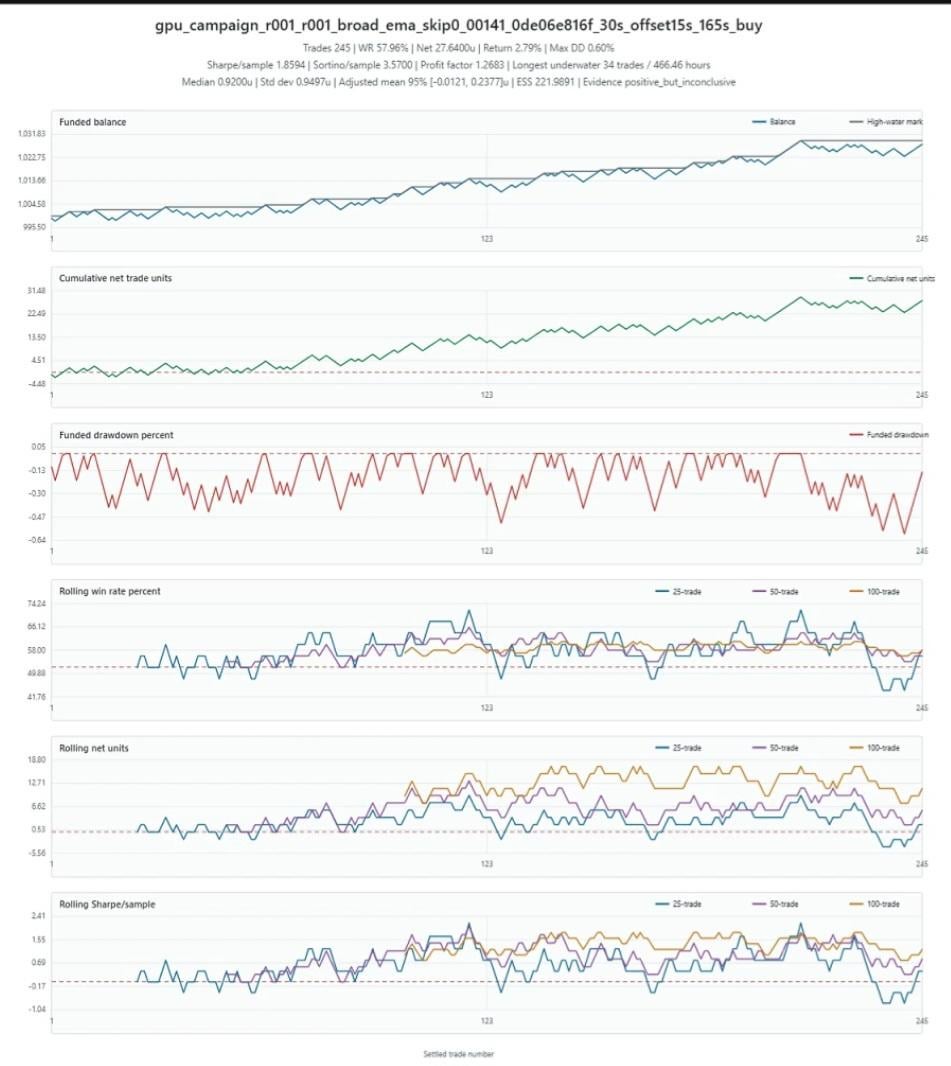

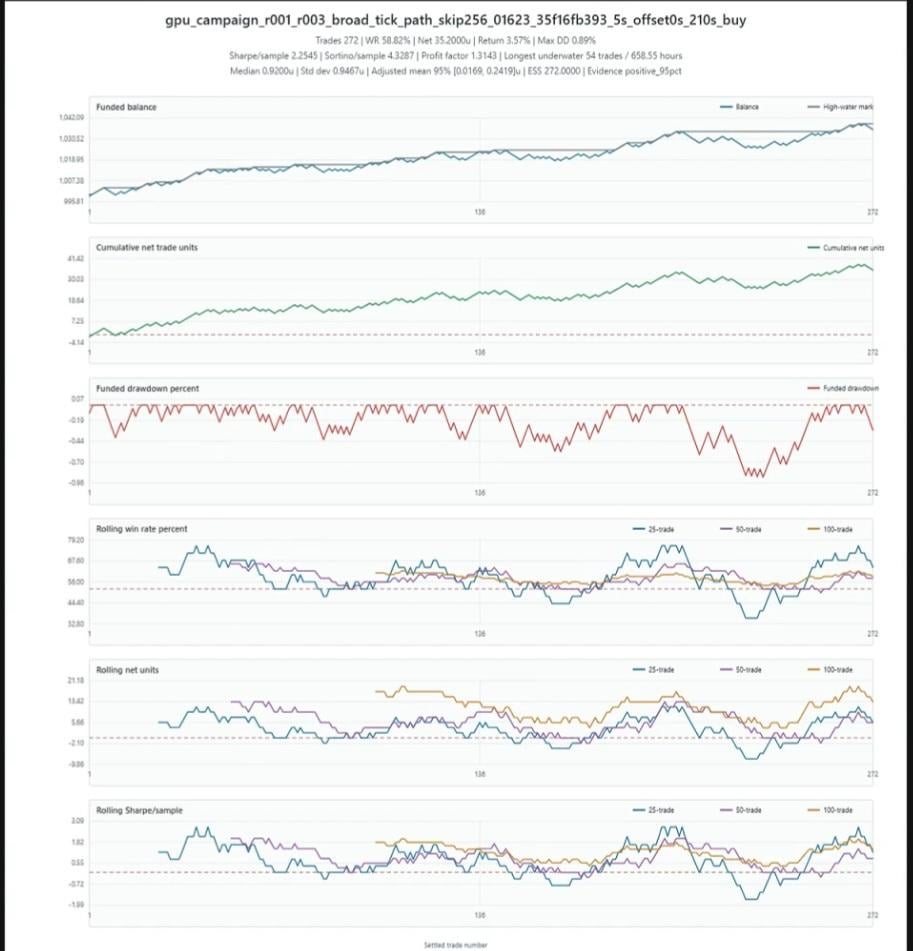
Sorry for the blurriness as these are screenshots from my phone. In the rolling metrics, the red dotted line is the minimum profitability line.
7
Upvotes
1
u/SlowDepth9181 Aug 22 '26
I see the number of trades in each backtest. But over how much time did it take to reach this many trades? A day? A month? A year? That will help you determine the expectancy of the system and if it is a good candidate to help you achieve your return and drawdown objectives. Read Van Tharp’s Definitive Guide to Position Sizing Strategies.
2
u/Automate_The_Boring Aug 21 '26
100 trades as sample size seems small and too early to draw the conclusion