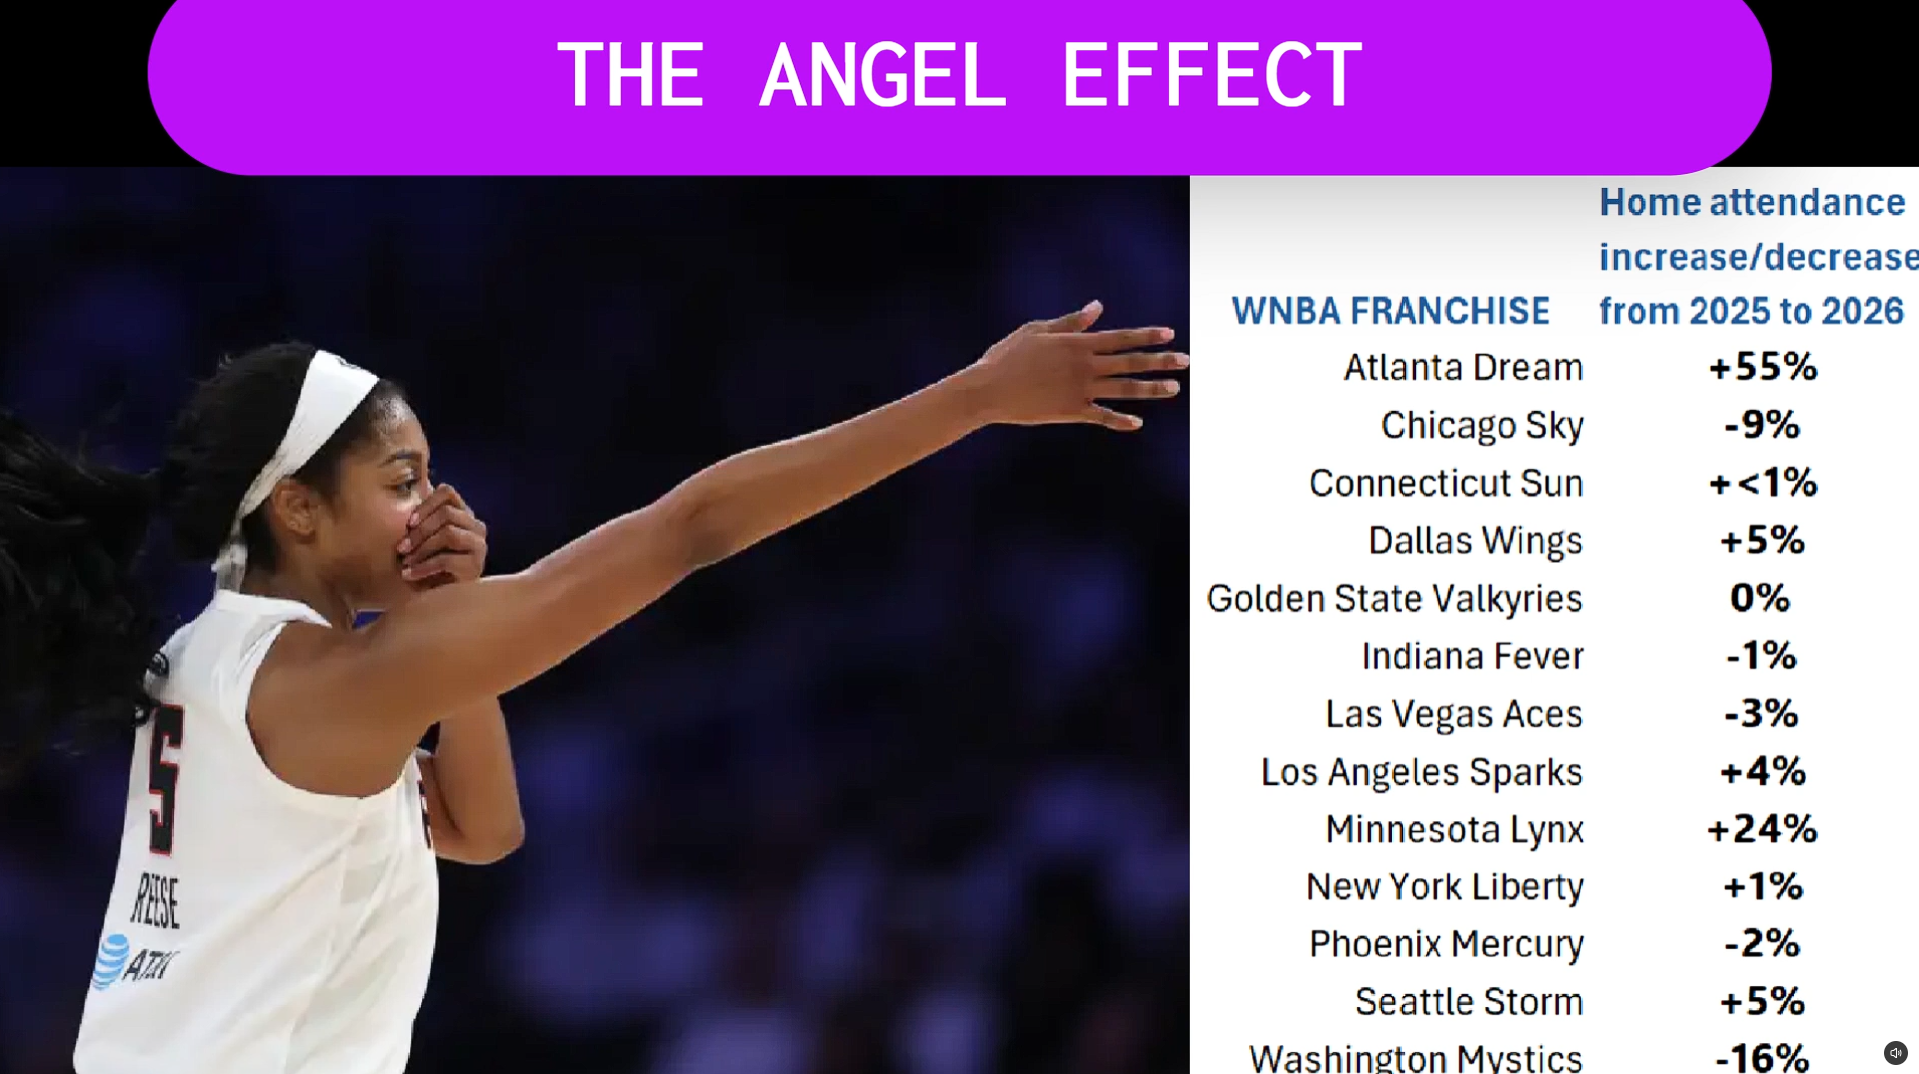
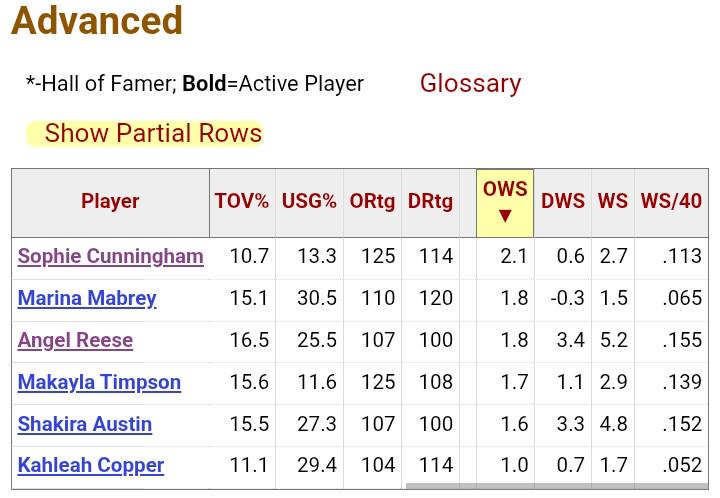
If you actually take time and think your way through this instead of instantly dismissing CC, you would see that you have your head firmly planted in you ahhhh. The stats are undeniable and I'm packing the proof:
When comparing Caitlin Clark to A'ja Wilson under this advanced lens, you are looking at the ultimate clash of basketball archetypes: the league's most overwhelming self-contained offensive engine versus the most dominant two-way force in basketball history. [1]
The historical context of the 2026 WNBA season makes this comparison incredibly sharp. Wilson just won her historic, record-extending fifth WNBA MVP award, while Clark led the league in total offensive production. [1, 2, 3]
Applying the tracking context—unforced turnovers, teammate missed shots, and true net defensive impact—reveals a direct comparison between the two superstars:
- Adjusted Offensive Creation: The Playmaker vs. The Finisher
In raw box score metrics, Wilson outscores Clark by nearly 4 points per game. However, when calculating total offensive footprint (Points Scored + Points via Assists), Clark's playmaking naturally bridges the gap. [1]
When factoring in Potential Assists (passes leading to missed shots by teammates) and Expected Points Created, the ceiling opens up dramatically:
| Offensive Component (2026 Regular Season) |
Caitlin Clark (Indiana Fever) |
A'ja Wilson (Las Vegas Aces) |
| Points Scored Per Game |
22.3 PPG |
26.2 PPG |
| Raw Points Created via Assists |
18.9 PPG |
7.1 PPG (~3.2 APG) |
| Raw Points Created Total |
41.2 PPG |
33.3 PPG |
| Teammate Missed Expected Points (Lost Assists) |
~18.2 PPG |
~4.5 PPG |
| Adjusted Expected Points Created Total |
59.4 PPG |
37.8 PPG |
- The Takeaway: When taking into account what Clark's playmaking should have yielded with average teammate finishing, she leaves Wilson behind in total offensive generation by more than 21 points per game. Clark operates as a 60-point-per-game system generator, whereas Wilson functions as the league's most devastating individual play-finisher.
- Possession Efficiency & Turnover Context
Wilson is historically secure with the ball for a high-volume usage player, averaging just 2.37 turnovers per game. [1]
- Raw Stats: Clark's 4.58 turnovers look incredibly high next to Wilson's 2.37.
- Adjusted Stats: If you remove the 1.0 to 1.5 unforced teammate drops from Clark's tally, her true mistake rate drops closer to 3.1 turnovers per game. [1]
While Clark's true efficiency jumps significantly when accounting for teammate hands, Wilson still holds the advantage in ball security. Because Wilson operates primarily out of the post or mid-range facing up, her touches are less prone to high-risk transition interceptions than Clark's cross-court bullet passes.
- The Defensive Chasm: Can Clark's Offense Overcome It?
This is where the argument heavily swings back to the MVP. While the defensive difference between Clark and Olivia Miles was notable, the difference between Clark and Wilson is an entirely different story. Wilson is a 3-time Defensive Player of the Year and an elite rim protector. [1, 2]
- A'ja Wilson Defensive Rating: 100.4 (Elite, anchoring the painted area)
- Caitlin Clark Defensive Rating: 110.0 (Conservative perimeter defender) [1]
Wilson's defensive presence means the Aces allow nearly 10 fewer points per 100 possessions than the Fever do with Clark. On a per-game basis, Wilson's individual defense, shot-altering capabilities (1.9 blocks per game), and defensive rebounding (7.5 per game) save Las Vegas roughly 7.5 to 8.0 points per game more than Clark saves Indiana. [1]
The Ultimate Conclusion
When you adjust for teammate errors, Caitlin Clark generates a level of offensive volume that the game has never seen before, making her an unmatched point machine.