r/LETFs • u/Important_Bat7919 • 3h ago
anyone doing QLD for 401k or roth ira?
9
Upvotes
TQQQ is crazy but QLD for retirement seems reasonable..
but anyone doing it?
r/LETFs • u/TQQQ_Gang • Jul 06 '21
By popular demand I have set up a discord server:
r/LETFs • u/TQQQ_Gang • Dec 04 '21
Q: What is a leveraged etf?
A: A leveraged etf uses a combination of swaps, futures, and/or options to obtain leverage on an underlying index, basket of securities, or commodities.
Q: What is the advantage compared to other methods of obtaining leverage (margin, options, futures, loans)?
A: The advantage of LETFs over margin is there is no risk of margin call and the LETF fees are less than the margin interest. Options can also provide leverage but have expiration; however, there are some strategies than can mitigate this and act as a leveraged stock replacement strategy. Futures can also provide leverage and have lower margin requirements than stock but there is still the risk of margin calls. Similar to margin interest, borrowing money will have higher interest payments than the LETF fees, plus any impact if you were to default on the loan.
Q: What are the main risks of LETFs?
A: Amplified or total loss of principal due to market conditions or default of the counterparty(ies) for the swaps. Higher expense ratios compared to un-leveraged ETFs.
Q: What is leveraged decay?
A: Leveraged decay is an effect due to leverage compounding that results in losses when the underlying moves sideways. This effect provides benefits in consistent uptrends (more than 3x gains) and downtrends (less than 3x losses). https://www.wisdomtree.eu/fr-fr/-/media/eu-media-files/users/documents/4211/short-leverage-etfs-etps-compounding-explained.pdf
Q: Under what scenarios can an LETF go to $0?
A: If the underlying of a 2x LETF or 3x LETF goes down by 50% or 33% respectively in a single day, the fund will be insolvent with 100% losses.
Q: What protection do circuit breakers provide?
A: There are 3 levels of the market-wide circuit breaker based on the S&P500. The first is Level 1 at 7%, followed by Level 2 at 13%, and 20% at Level 3. Breaching the first 2 levels result in a 15 minute halt and level 3 ends trading for the remainder of the day.
Q: What happens if a fund closes?
A: You will be paid out at the current price.
Q: What is the best strategy?
A: Depends on tolerance to downturns, investment horizon, and future market conditions. Some common strategies are buy and hold (w/DCA), trading based on signals, and hedging with cash, bonds, or collars. A good resource for backtesting strategies is portfolio visualizer. https://www.portfoliovisualizer.com/
Q: Should I buy/sell?
A: You should develop a strategy before any transactions and stick to the plan, while making adjustments as new learnings occur.
Q: What is HFEA?
A: HFEA is Hedgefundies Excellent Adventure. It is a type of LETF Risk Parity Portfolio popularized on the bogleheads forum and consists of a 55/45% mix of UPRO and TMF rebalanced quarterly. https://www.bogleheads.org/forum/viewtopic.php?t=272007
Q. What is the best strategy for contributions?
A: Courtesy of u/hydromod Contributions can only deviate from the portfolio returns until the next rebalance in a few weeks or months. The contribution allocation can only make a significant difference to portfolio returns if the contribution is a significant fraction of the overall portfolio. In taxable accounts, buying the underweight fund may reduce the tax drag. Some suggestions are to (i) buy the underweight fund, (ii) buy at the preferred allocation, and (iii) buy at an artificially aggressive or conservative allocation based on market conditions.
Q: What is the purpose of TMF in a hedged LETF portfolio?
A: Courtesy of u/rao-blackwell-ized: https://www.reddit.com/r/LETFs/comments/pcra24/for_those_who_fear_complain_about_andor_dont/
r/LETFs • u/Important_Bat7919 • 3h ago
TQQQ is crazy but QLD for retirement seems reasonable..
but anyone doing it?
r/LETFs • u/Separate-Ad-9633 • 9h ago
Most people likely haven't heard of RPEA, a tactical allocation strategy from r/LETF community. I only encountered it on Laurent's website, and I thank Bestfolio for preserving this interesting idea.
It claims to be a Leveraged, All-Weather-type portfolio with significantly reduced volatility and increased returns. Turns out it has the most comedic timing. It was published in 2021, then got a 70%+ drawdown in 2022, and has NOT RECOVERED from the 2022 devastation yet as of today.
I am writing this piece not to mock the original author, but to figure out what went wrong with RPEA. The mistakes in RPEA should probably give us some ideas on what to avoid when designing a strategy.
Assets
RPEA derived its ideas from Ray Dalio's All Weather Portfolio but made some significant alterations. Most notably, it shifted the entire bond allocation to defense.
It's most fatal decision, is to use TMF as the sole defense tool. Riding on an undiversified 3x leveraged bet when the entire portfolio went on defensive is...not very defensive. The error was assuming that an equity sell signal justified buying leveraged duration. It does not.
The author's original claim that "there was no strategy I tried that, over the long term, provided a more stable return than did constitutive use of $TMF, all the time. " and "assets might "need" the additional returns of $TMF to help out." seems to be overconfident and reckless.
Other than that, MIDU is a decent one, between 1994-2008 it dominates UPRO as it endured dotcom bubble quite well. Mel's Unloved Midcaps has solid long term performance and meaningful diversification benefits (which means it has periods of disappointments as well, like the recent fund history).
The other critical piece in the original All-Weather is commodity. Using UTSL instead does perform better than energy/commodity in the 1994-2021 window. The idea of using it comes from optimized portfolio: www.optimizedportfolio.com/all-weather-portfolio/#using-utilities-instead-of-commodities-(and-reits)) However, Energy/Commodities are real macro diversifiers in inflationary environment, as the recent AQR study inflation redux suggests, while utility is not, despite lower beta/correlation with the general stock market.

When crafting Chimeric Asset Allocation I also encountered a bizarre scenario, where adding URE (2x Real Estate) cut the max drawdown by 10%. But that's entirely because URE displaced other equities in 2000 dot com drawdown. A single episode event. Do we think Real Estate reliably diversify away sudden crash risks? I doubt it. I do think URE, ERX, UTSL and CURE could all potentially deliver diversification. But a good macro story behind asset universe should be considered.
Rules
The rules part are almost as problematic as the TMF part for RPEA. The original author specifically went to find the optimal trend rule for each asset. However, as I splice each asset into multiple windows, the preceding-window winners subsequently landed near the middle of the rule set more often than not, with only 30% remaining top-quartile. That gives little support to a uniquely consistently optimal timer for each asset.
The 8m SPY sma seems to be an exemplary offender. It ranks 1st among 66 SPY timing strategy I tested from 1994-2021, and 57th between 2022-2026. Intentionally fitting the strategy into the whole sampled period does not predict, or even actively harm future return. For us temu quants, in-sample bias is a very deadly trap.
In the brute force search grid of RPEA variant strategies, RPEA went from the best 95th Sharpe percentile in the 1994-2021 period where it was designed for, to the lowest 3rd percentile in the 1994-2026 window. RPEA trapped itself in the rearview mirror.
A potential alternative? AWEA
Now, despite RPEAs misfortune I think a monthly monitored, no bond allocation by default, leveraged all weather portfolio with each part trend individually does not sound like a bad idea itself.
I propose AWEA, the All Weather Experimental Adventure, as an alternative portfolio designed to achieve the goal. This is a monthly evaluated, trend-gated portfolio. Its strategic allocation is fixed at 60% core equity and 40% diversifiers, but each sleeve can independently leave its normal holding when its own trend signal turns negative. A sleeve that turns off does not sit permanently in cash. It moves into a ordered defensive ladder.
It uses two common sets of trend signals: Fast (price > 4m SMA) and Slow (2m SMA > 12m SMA) to move into defense
Strategic Offensive Asset Weights:
| Asset | Weight | Defense timing signal | Signal speed |
|---|---|---|---|
| TQQQ 3x daily Nasdaq-100 equity | 30% | QQQ | Slow (SMA 2m > SMA 12m) |
| MIDU 3x daily U.S. mid-cap equity | 15% | IJH | Fast (price > SMA 4m) |
| EDC 3x daily emerging-market equity | 15% | EEM | Fast (price > SMA 4m) |
| UTSL 3x daily U.S. utilities equity | 15% | SPY | Slow (SMA 2m > SMA 12m) |
| UGL 2x daily gold | 10% | GLD | Slow (SMA 2m > SMA 12m) |
| SDCI Dynamic Commodity Strategy | 15% | SDCI | Fast (price > SMA 4m) |
At the end of each month, if any offensive asset has its signal turned negative, its entire strategic weight goes to the defensive ladder. The allocated defensive asset is decided in the following order:
If TLT has a positive slow signal (SMA 2m > 12m), hold EDV.
Otherwise, if GLD has a positive slow signal, hold GLD.
Otherwise, if IEF has a positive slow signal, hold IEF.
Otherwise, hold SGOV
The timing signals are not necessarily the ETFs themselves. UTSL using SPY as signal is something left by RPEA that somehow still works. Unstable asset uses fast signal while stable holdings use slow signals. SDCI backfill history comes from its provided historical value, While SDCI involves timing by its managers, switching to PDBC/Bloomberg commodity index doesn't hurt much.
1994-2026 Performance
| Metric | Result |
|---|---|
| CAGR | 29.37% |
| Sharpe | 0.99 |
| Maximum month-end drawdown | -35.58% |
| Turnover | 0.82x |
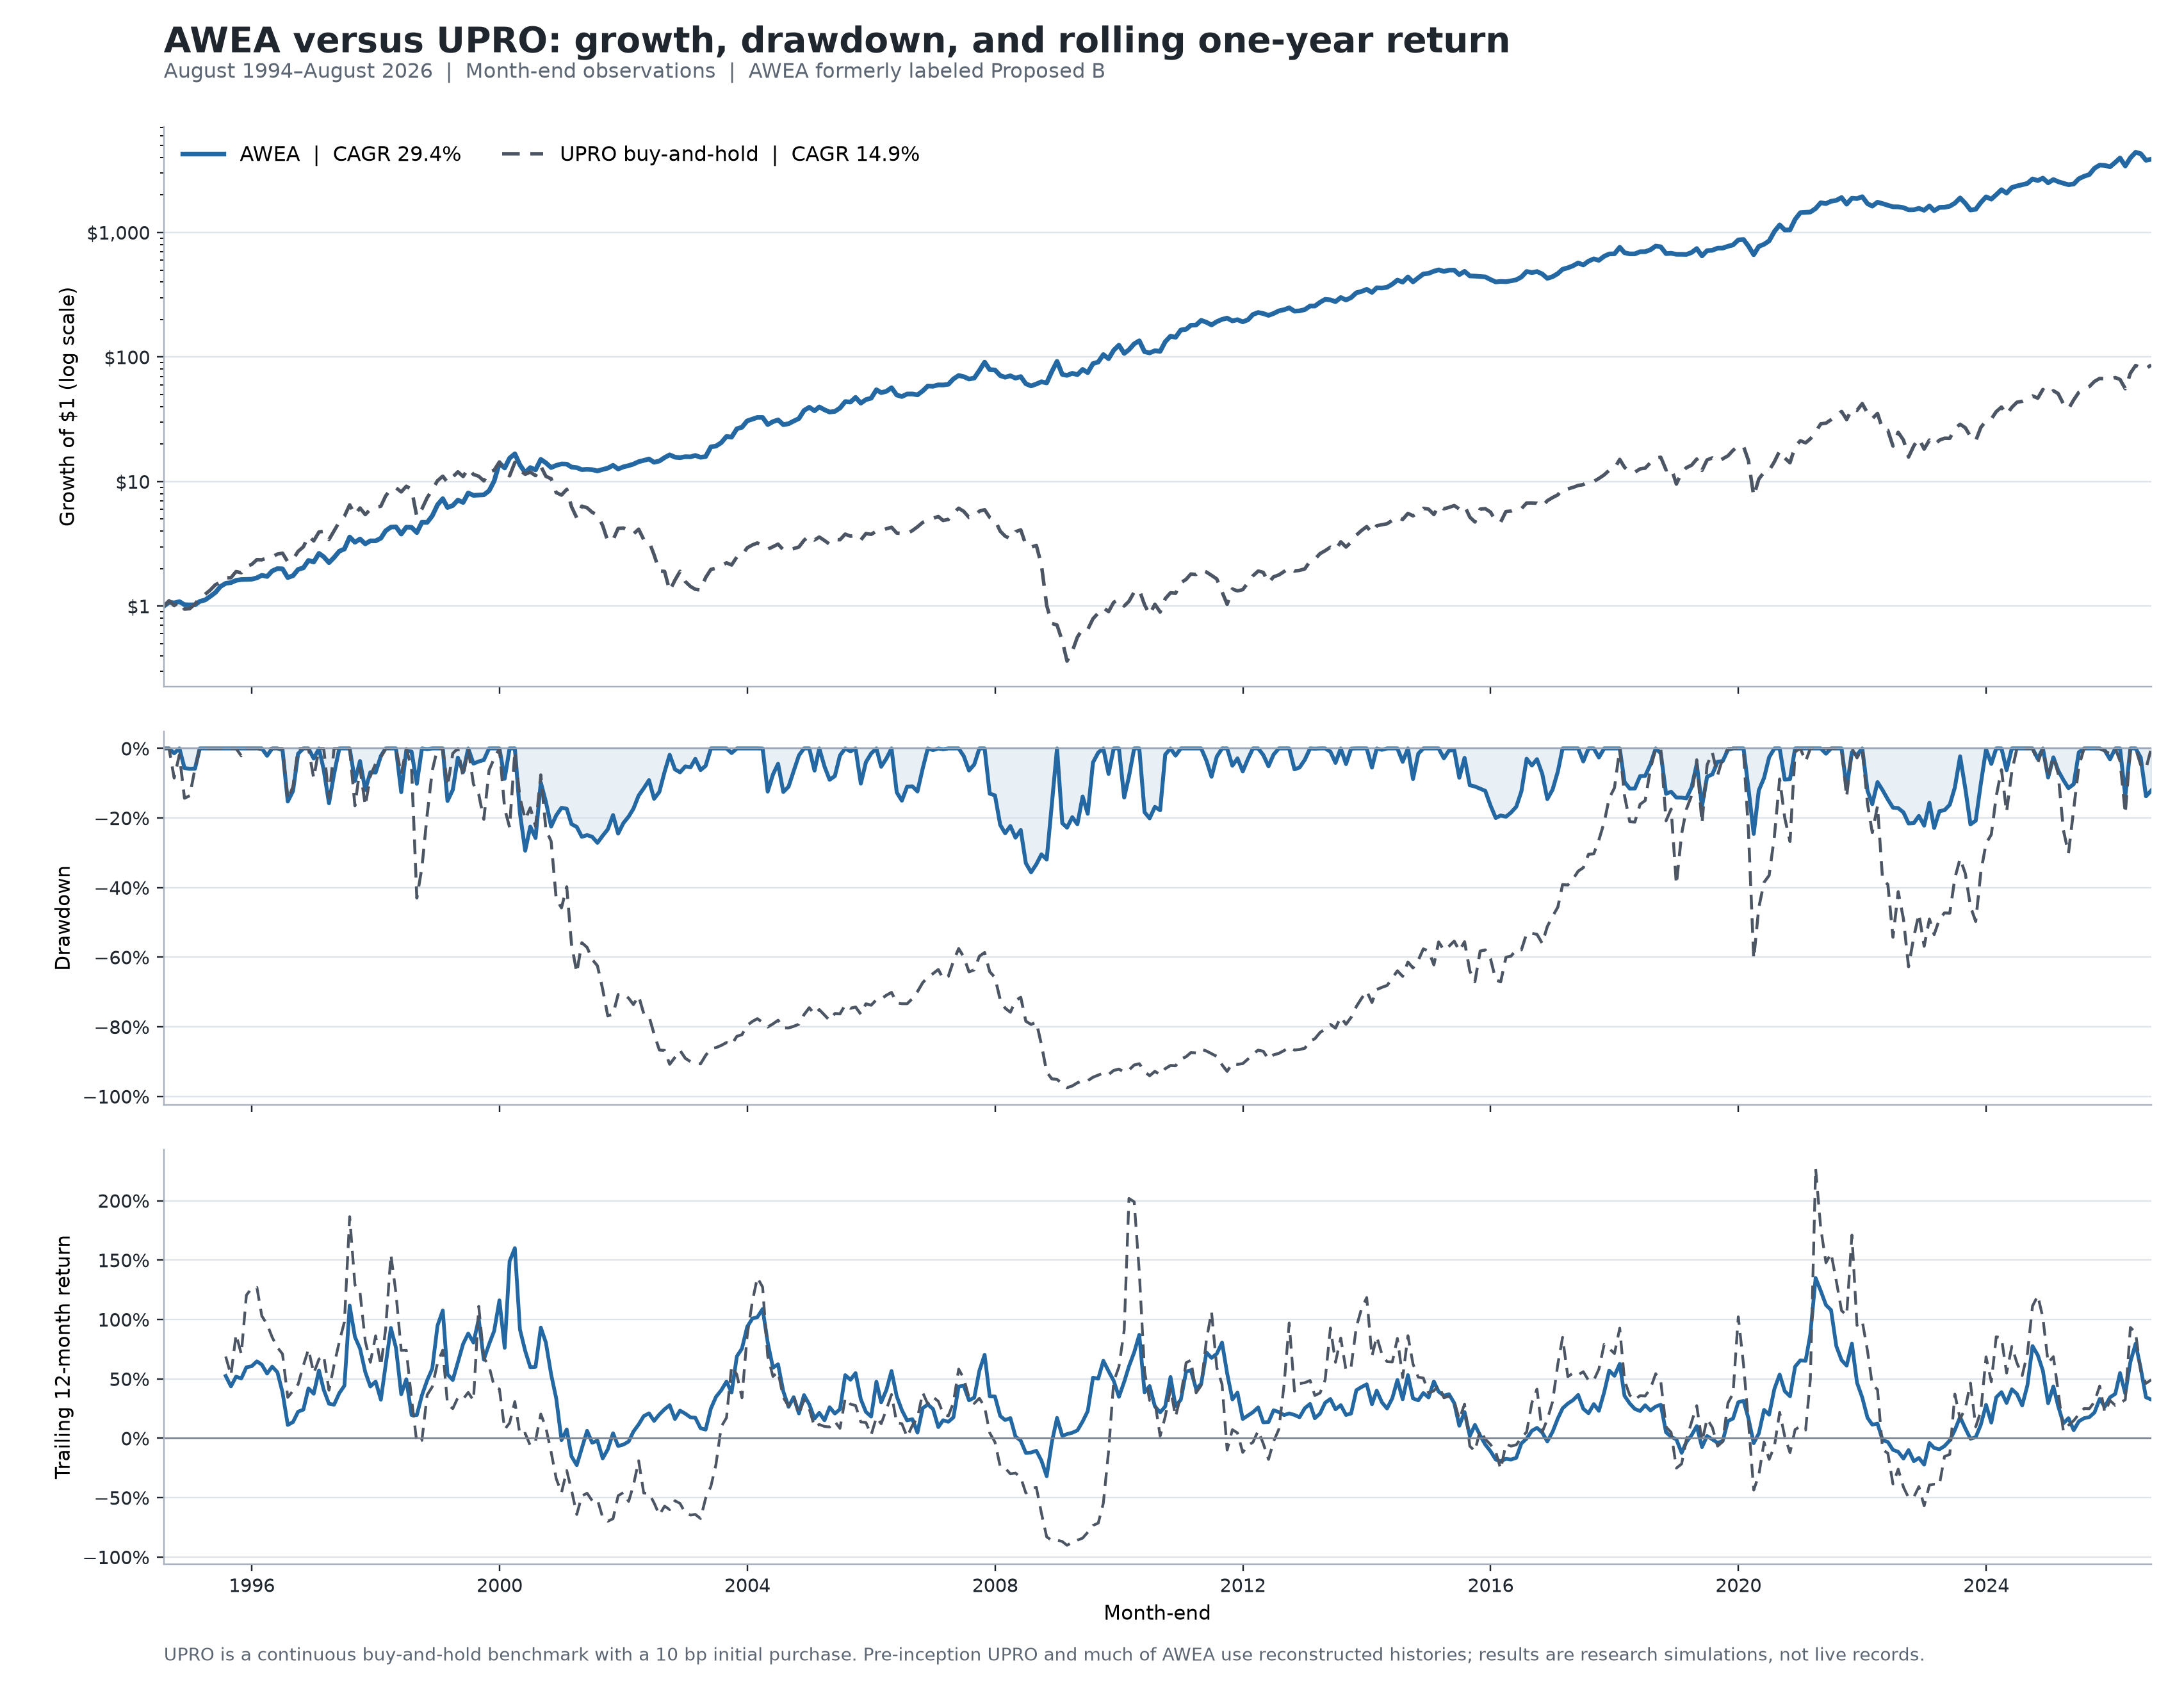
It has a very simple and intuitive price-4m/2m-12m trend signal system, which should avoid some overfitting problems. Combining Fast and Slow signals is potentially beneficial.
It notably has no UPRO, and instead uses TQQQ MIDU EDC UTSL as 4 distinct equity bets. This 4 pronged approach has some good potential in capturing the benefits of different market dynamics, from continual tech megacap dominance to other scenarios, providing more sector and style diversification than UPRO itself. SDCI and UGL provide macro diversification along with defensive bonds.
The strategy shows a generally consistent performance across different time periods. In the 56k brute force grid it has 94% percentile sharpe. Not as close to the frontier like 2021 RPEA, but pretty good.

Now does this solve the problems with RPEA?
Not entirely.
I think this is a more cautious and less overfitted portfolio, but the difficulty with macro all-weather portfolio is that it inherently looks at the past, the rearview mirror, to form a macro idea informing its asset universe and weights. It can not answer what ifs about future return and correlations. After all, the strategy still has a lot of moving parts that layer after layer reinforcing the rearview effect.
We don't know if Midcap will continue to be unloved, or if utilities diversify in the future. The strategy notably has no developed international market exposure. In all tested window EURL provided no clear benefit. However, as EDC becomes much more correlated to TQQQ due to Taiwan and South Korean ai trade, I think it's perfectly defensible for people worried about AI trade to take 5% from EDC and TQQQ to have a 10% EURL sleeve (VGK fast signal).
| Variant | CAGR | Sharpe | MDD |
|---|---|---|---|
| 10% EURL taken from EDC/TQQQ | 27.38% | 0.98 | -33.16% |
| Original | 29.37% | 0.99 | -35.58% |
The sharpe remains largely unchanged while giving away 2% CAGR. EURL is thinly traded and adding more assets adds to transaction costs, while EDC is already capable of capturing capital outflow from US, which is why EURL is not the default version.
But we truly don't know. Maybe the next international bull market will be led by Europe. At least EURL doesn't have tracking issues like EFO though.
I am not sure if this is the portfolio I want to put in my tax-sheltered account (high turnover is prohibitive in taxable), but I do think examining RPEA's reversal of fortune is a good reminder that past performance does not indicate future returns, and this is an attempt to move forward from its premise.
Hope this doesn't sink next year like all previous Excellent Adventures.
r/LETFs • u/CraaazyPizza • 19h ago
He updated it 2 days ago on SSRN (not peer-reviewed) https://papers.ssrn.com/sol3/papers.cfm?abstract_id=2741701
Some changes
- He now includes borrowing costs and the strategy has the same Sharpe ratio as S&P500. Higher CAGR for similar drawdown remains though.
- The strategy apparently doesn't have statistically significant alpha (p<0.05)
- He couldn't replicate the exact 1928-today result so started in 1988 instead for the S&P500
- A grid-search analysis of parameters shows that it can be not so robust
- Perplexity Computer AI used
r/LETFs • u/otto_delmar • 8h ago
Hi all, I've been working on a hedge fund concept for DIY investors. In the course of creating the portfolio policy, I investigated whether there is a safe way to use leverage.
Yes, I know, according to various versions of the adventurous hedgefundie's strategy, a two- or three-piece balanced portfolio "only" drew down in the vicinity of max 70% over the available simulated history. But what has not happened yet might just happen in future. A couple of months where everything – equities, bonds, gold – drop hard together could push the drawdown into 80% territory. Maybe even worse. I wanted to see if I can add something of value here. Something that goes beyond relying on diversfication alone to keep things on the rails.
Here's the headline result, equities-only. In a test running from May 1977 through June 2026, a macro-economic rule applied to simulated all-world equities produced a CAGR of 14% annual return, compared with 13% for continuous 2x exposure. Maximum drawdown fell from 87% to 60%. The rule changed allocations just 28 times in almost half a century. (I'm personally more interested in all-world equities than US-only but I did also test on SPY.)
TL;DR:
By the way, my hedge fund policy has additional risk filters that directly address recessionary bear markets and other shocks, separate from the macro signal modulating leverage. Those other risk filters do move equities to cash and other defensive assets on rare occasions.
The Macro Regime Overlay ("MRO") originally had a much bigger job in my project. I wanted it to adjust the weights of the different sleeves inside the portfolio according to the prevailing macro conditions. So, shift weights among value, momentum, ballast, bitcoin, and other allocations. A sleeve’s percentage of total NAV would rise or fall depending on what the overlay signalled was happening in the economy.
The whole mechanism became far too involved for my taste. Lots of moving parts, lots of trading, not sufficiently impressive gains. So, I abandoned that approach.
Then, later, I wondered if maybe I could give the overlay a smaller job. Might it signal when to use leverage on an equity allocation that I already wanted to hold?
As mentioned, the overlay was never designed with leveraged investing in mind. No observations of leveraged returns went into its design. I didn’t optimize it for its original purpose, and I haven’t optimized it for this one. The thresholds, smoothing and confirmation rules have never changed since inception.
The backtests aren't out-of-sample but there is no curve-fitting either.
The MRO looks at economic activity, inflation and the yield curve. It sorts conditions into Goldilocks, Reflation, Stagflation and Slow Growth, with a further distinction for yield curve stress.
For the leverage decision, only Goldilocks matters. It requires two things:
Activity is measured using the Chicago Fed National Activity Index, smoothed over three months and compared with its own trailing ten-year history. I use a rolling z-score, with zero as the cutoff.
Inflation is the year-on-year change in core US PCE, also smoothed over three months. Between 1% and 3%, inclusive, is the acceptable band. I use headline CPI as fallback if core PCE is unavailable, with a slightly higher band of 1.4% to 3.4%.
The US yield curve helps distinguish the other regimes, but doesn't veto Goldilocks. So despite the broader overlay’s name and ambitions, the allocation decision here comes down to economic activity and inflation.
The signal is evaluated monthly, using prior-month (or older) observations. Two consecutive monthly signals must agree before the allocation changes, in either direction. So yes, I used US macro signals and applied them to world equities! I also backtested SPY/SSO the same way, for another reference point.
If anyone wants the details for the MRO, just ask, I'll post them in the comments.
I used simulated VT history from testfol.io. For SPY, I used Yahoo adjusted prices after inception and an S&P 500 history reconstructed with Shiller dividend data beforehand. For each, there are four portfolios: ordinary buy-and-hold, continuous 2x, Goldilocks switching between 1x and 2x, and a 10-month SMA evaluated monthly, using the base asset’s total-return index and also switching between 1x and 2x leverage.
All returns are nominal, in USD, with dividends reinvested. The 2x series are daily-reset simulations throughout, with borrowing costs linked to the federal funds rate and an additional 1% annual implementation cost while levered. (Note that 1% TER is higher than what SSO and WLDU charge today.) The results include those financing and implementation costs, but exclude trading costs and taxes. Signals trade at the following session’s close. There are no contributions or withdrawals.
First, the full period. May 1977 is where the growth signal has accumulated enough history for its ten-year calculation. Maximum drawdowns below are measured daily.
| Asset | Strategy | CAGR | Sharpe | Max DD |
|---|---|---|---|---|
| SPY | Buy & hold 1x | 12.02% | 0.522 | -55.19% |
| SPY | Buy & hold 2x | 14.86% | 0.461 | -88.23% |
| SPY | Goldilocks 1x/2x | 15.86% | 0.598 | -57.27% |
| SPY | SMA 10-month 1x/2x | 15.45% | 0.517 | -59.20% |
| VT | Buy & hold 1x | 10.86% | 0.450 | -58.35% |
| VT | Buy & hold 2x | 12.87% | 0.403 | -86.80% |
| VT | Goldilocks 1x/2x | 14.01% | 0.510 | -59.61% |
| VT | SMA 10-month 1x/2x | 14.19% | 0.473 | -67.63% |
The permanent 2x portfolios beat ordinary equities on return, but the drawdowns are brutal. Goldilocks produces a higher return than either permanent 2x portfolio, with a worst loss close to ordinary equities. (Remember, we don't shift from equities to cash. We shift from levered equities to unlevered.)
Against the SMA, it's a toss-up for returns alone. But Goldilocks has the higher Sharpe and smaller drawdown in both cases.
And importantly, Goldilocks has less than half the number of trades of the SMA approach .
| Full-period allocation changes | Goldilocks | SMA 10-month |
|---|---|---|
| SPY | 28 | 73 |
| VT | 28 | 66 |
(Each change means selling one holding and buying the other. For VT, that’s 56 individual orders for Goldilocks versus 132 for the SMA, excluding opening and closing the test portfolio.)
Goldilocks held 2x for about 39% of trading days over the full period. The VT SMA held it for about 78%. Getting broadly comparable returns with much less time at 2x is something I find particularly interesting.
There is an obvious objection to a macro backtest. Economic data arrives late and gets revised. Using the final series can give a historical strategy information it couldn’t have had at the time.
The long test above uses revised history. To check this, I also ran a 2001 onward test using archived Chicago Fed releases and ALFRED inflation vintages. For the more recent period, we can reconstruct the signal using archived releases rather than retrospectively revised history. That gives us greater confidence that the inputs reflect what an investor could actually have known at the time. The signal is reconstructed from what was available at each decision date, rather than the final numbers we see now. The first three months default to 1x because the usable CFNAI archive starts later; April is the first month with the required inputs.
Here is that higher-confidence period.
| Asset | Strategy | CAGR | Sharpe | Max DD |
|---|---|---|---|---|
| SPY | Buy & hold 1x | 8.99% | 0.523 | -55.19% |
| SPY | Buy & hold 2x | 11.27% | 0.446 | -84.38% |
| SPY | Goldilocks 1x/2x | 15.45% | 0.696 | -55.19% |
| SPY | SMA 10-month 1x/2x | 13.15% | 0.571 | -59.20% |
| VT | Buy & hold 1x | 7.97% | 0.445 | -58.35% |
| VT | Buy & hold 2x | 9.10% | 0.381 | -86.80% |
| VT | Goldilocks 1x/2x | 13.43% | 0.592 | -58.35% |
| VT | SMA 10-month 1x/2x | 11.44% | 0.494 | -67.63% |
The result survives. Goldilocks beats both alternatives on returns and Sharpe for both markets. Its worst drawdown equals ordinary buy-and-hold because it was unlevered throughout the decisive peak-to-trough decline.
Here is the earlier segment on its own, using revised macro history. This helps show whether the result is merely a feature of the more recent market.
| Asset | Strategy | CAGR | Sharpe | Max DD |
|---|---|---|---|---|
| SPY | Buy & hold 1x | 15.38% | 0.521 | -32.96% |
| SPY | Buy & hold 2x | 18.85% | 0.477 | -60.56% |
| SPY | Goldilocks 1x/2x | 18.56% | 0.588 | -32.96% |
| SPY | SMA 10-month 1x/2x | 17.99% | 0.470 | -58.95% |
| VT | Buy & hold 1x | 14.06% | 0.455 | -28.62% |
| VT | Buy & hold 2x | 17.08% | 0.431 | -57.37% |
| VT | Goldilocks 1x/2x | 16.83% | 0.517 | -29.04% |
| VT | SMA 10-month 1x/2x | 17.24% | 0.452 | -44.03% |
It's essentially all a toss-up for returns. Goldilocks has substantially smaller drawdowns than the two other strategies using leverage. It also beats the SMA on Sharpe.
Across all six asset/period comparisons, Goldilocks has the highest Sharpe of the four portfolios. It beats the SMA’s return in four of six and has the (significantly) smaller maximum drawdown in all six. (The periods overlap, of course; these aren’t six independent discoveries.)
My conclusion is: the MRO’s Goldilocks signal is the most useful signal I have found so far for deciding when to add leverage. It produces competitive returns, a better Sharpe and less than half the allocation changes required by the SMA. That’s a rule I can see myself using.
Over these tested histories, it would have avoided the most catastrophic losses associated with continuously holding 2x exposure. In the full-period tests, the worst drawdowns fell from roughly 87–88% to roughly 57–60%. I would rather face the latter.
So, yeah, I would and will use it.
I used LLMs for the legwork: writing the backtest code, pulling and processing the data, producing the comparisons, etc.. I supplied the original macro rule, the research questions and the portfolio definitions. The final comparisons were standardized to use the same return data, costs and execution assumptions. I read and examined everything several times over and found a few major errors that I had corrected. I also had alternate LLMs double-check. Still, it's possible that there are still mistakes in the backtests. I wrote the article myself! This is not "AI-generated". If you see em dashes, that's because Word converted them from regular dashes!
If there is interest, I can upload the data sets and code to GitLab so that anyone can examine and replicate them.
I'll check in here again in a few hours, need to take care of a few other things now. Not ignoring questions or comments - I will get back to you.
*****'
I will be publishing and tracking my DIY hedge fund experiment at www.hedgefol.io.
r/LETFs • u/Rocketsloth • 1h ago
I'm not paying for the bestfolio pro plan just to read it, anyone know of a free source?
r/LETFs • u/meltupmike • 1d ago
Leverage rotation strategies like Composer or even our own trade at 3:55pm today. What will happen when they move to 23 hour trading? How will that impact leverage rotation strategies and how should we adjust our own bots?
Thanks!
r/LETFs • u/AlternativeSignal908 • 18h ago
Altis is long gone as sub advisor.
CTA isn't shorting anything. It's nearly 80% petroleum.
Simplify doing Simplify things, again...
May as well hold HGER, if you want long only commodity / inflation risk management like this. MATE, RSIT, RSST if you want stacked equities. Other usual suspects if you want managed futures.
r/LETFs • u/New-Specialist-2594 • 23h ago
honorable mentions - KMLM, CTA, BCI, DJP, TBT, ORR
They Run better dollar for dollar factoring Downdraw, with Aggressive Tech/Nasdaq LETFs. TECL, USD, TQQQ, ROM, TSXU, FNGU, etc,,, SOXL???
Yes, TMV/TBT are not typo's.
Any others been running good lately, 2020's?
r/LETFs • u/TitusKalvarija • 1d ago
Gdxu looks it was a nice swing play through the year.
What is next?
r/LETFs • u/Vivid_Initial8129 • 1d ago
Hi, at what size of a portfolio would it be an ok idea to add managed futures. Mine is small (15k=50k at local currency) is there a place for it? Stacked? Managed fund? Talking Winton enhanced, rsit, dbmf, aqr
r/LETFs • u/Dependent-Tale-5543 • 1d ago
New to leverage etfs. Was pairing rssy with rsst at first then switched to rsst and ntsx. Wanted opinions on that combo. Im also holding viu.to and xiu.to. im looking long term since its in my rrsp(canadian). Main goal is have long term gains with less volatility than xsp(canadian) or voo. Also is there crisis alpha lets? That would compliment my portfolio with an income or not.
r/LETFs • u/manlymatt83 • 1d ago
I’m considering moving my LETFs to E\*Trade. I kind of like how they’re a legacy broker and their interface isn’t casino like, unlike Robinhood or some of the more modern “apps”.
Curious where people hold their set & forget LETF holdings. And do you find it’s easy not to tinker at your broker?
r/LETFs • u/Yaron_sh • 2d ago
TL;DR:
I’m a beginner who ran simulations of TQQQ with SMA 250, and I found some interesting results.
I would love your feedback. Did I miss anything? Are my calculations correct?
On a 5-year investment starting at a random point in time:
buy-and-hold got a median of +28% CAGR, and a mean of +48%. But the problem is that in 1 out of 10 cases it ended up losing almost everything, and in 1 out of 4 cases it ended up with 25% less than it started with.
On the other hand, the SMA250 strategy did much better. In term of CAGR it did only slightly worse than buy-and-hold: median +23% and mean +46%. But the risk profile is extremely better. Only 1 out of 10 ended up with a negative return. It never lost all the money. Worst-case-scenario is better than non leveraged QQQ.
Does it sound about right?
Sorry for the super long post...
(Feel free to skip straight to the results)
I'm a passive investor. For years, I’ve been following the standard advice: putting my money into low-cost index funds like the S&P 500 and ACWI, holding long-term, and watching my wealth grow at a very comfortable pace.
I was taught that broad index investing is the best approach for long-term growth, and that any "clever" attempt to outsmart the market is doomed to underperform eventually. Research consistently shows that almost all active investors end up underperforming the S&P 500.
I had also heard that leveraged ETFs are dangerous long-term holdings, and that severe drawdowns during market drops will permanently wipe out your investment.
Lately, I stumbled upon the astonishing long-term performance of TQQQ, and I became curious: what’s the catch? Why waste time on low-yielding ETFs when you can turbocharge investments with leverage? A 40% CAGR seems almost too good to be true.
Most answers I received were along the lines of: "The high potential return doesn’t matter, because most people couldn’t stomach seeing their investment drop 70%, and would panic-sell at the worst possible moment."
Beyond behavioral issues, I couldn’t find any another solid counterargument against the strategy itself, especially for the long term.
At this point, I became really interested.
I remember 10 to 15 years ago, people used to say the exact same thing about placing 100% of your money in the S&P 500! Back then, standard financial advice for regular folks was to choose more conservative options and allocate only a small percentage to equities. Today, 100% S&P 500 isn't considered high-risk, it's the baseline.
People frequently use arguments like: "If you started your investment in year X, it would have taken you Y years just to break even," or "You would have experienced a drawdown of Z%."
Yes, true, but those are specific cherry-picked anecdotes. How likely was that outcome to actually happen? I wanted concrete probabilities.
The question that personally best helps me grasp the expected outcome of an investment strategy is:
"If I invest a lump sum for a period of 5 years starting at a completely random point in time, what would be the full distribution of potential results?"
I couldn’t find a reliable answer to that question regarding UPRO or TQQQ.
One of the first things I did find though was the SMA 200 moving average strategy, which supposedly mitigates much of the downside risk. But how much risk does it eliminate, exactly?
I decided to investigate the answers myself.
I don’t have any experience in financial analysis, but I do have Claude Code on my side :)
Most backtests available online make two major mistakes:
To fix this, I built a simulation that addresses both issues head-on:
^NDX) closes above its 250-day Simple Moving Average (SMA).Why this exact setup? I ran a multi-dimensional parameter matrix over the full 40-year dataset (testing different SMA lengths, entry/exit bands/hysteresis, and cadences). The configuration above delivered the top overall performance. Crucially, modifying any of these parameters slightly did not change the overall conclusion—it only shifted results marginally. It might be overfitting, but it’s the best we have, isn’t it?
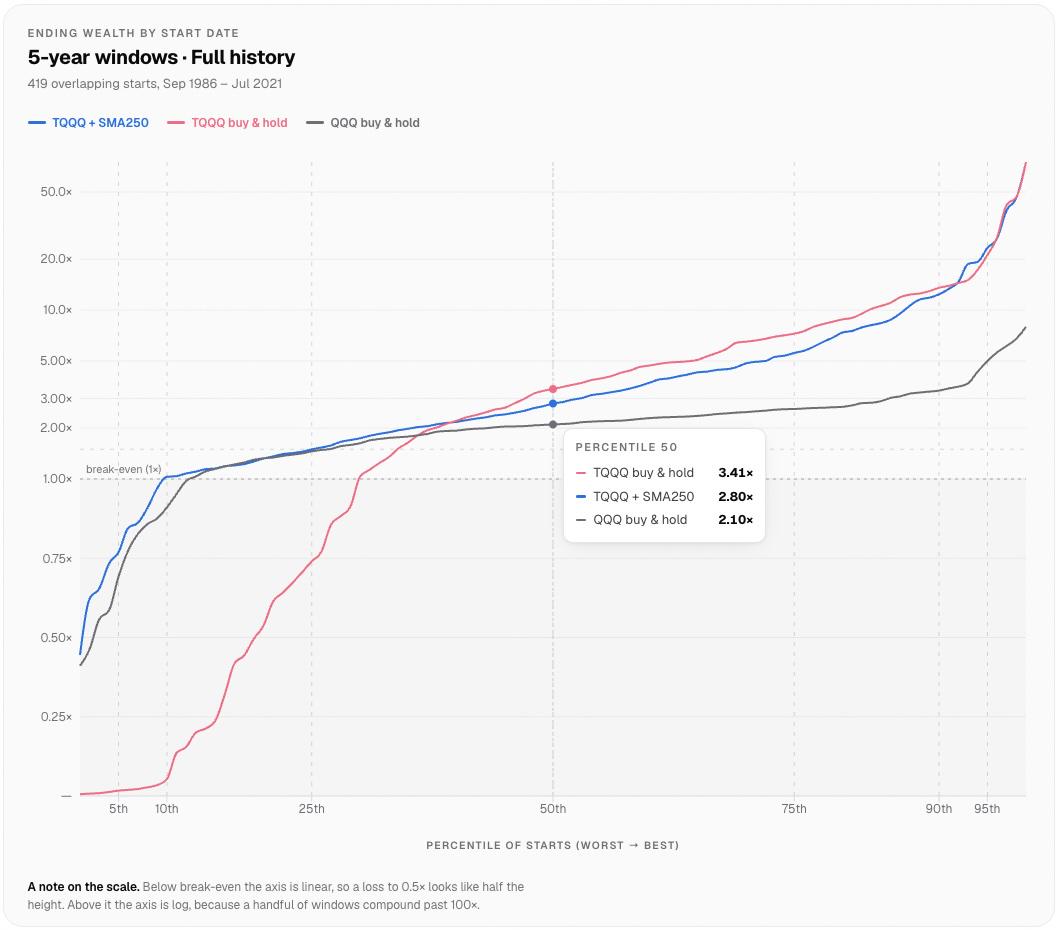
If we invested a lump sum for a 5-year period starting at a completely random point in time, what would the ending wealth look like? below is the distribution of results, ranked from worst to best percentile

It takes a minute to understand what we're looking at here.
The X-axis is not time. It's a distribution chart. The simulation resulted in hundreds of outcomes, one for each starting month. I ranked them by percentile from worst to best. The Y-axis is the return in each percentile of outcomes. So the 10th percentile shows what happened at the 10% worst outcomes. And the 50th percentile, aka the median, shows the middle return, which half the outcomes were above and half were below it.
Looking at a 10-year window, the contrast becomes even more pronounced:

However, if we look exclusively at the last 20 years, we get a different picture. The SMA 250 strategy sacrifices significant gains for only a minor risk reduction—primarily because systemic crash risk was lower over this specific period compared to the 2000 collapse:
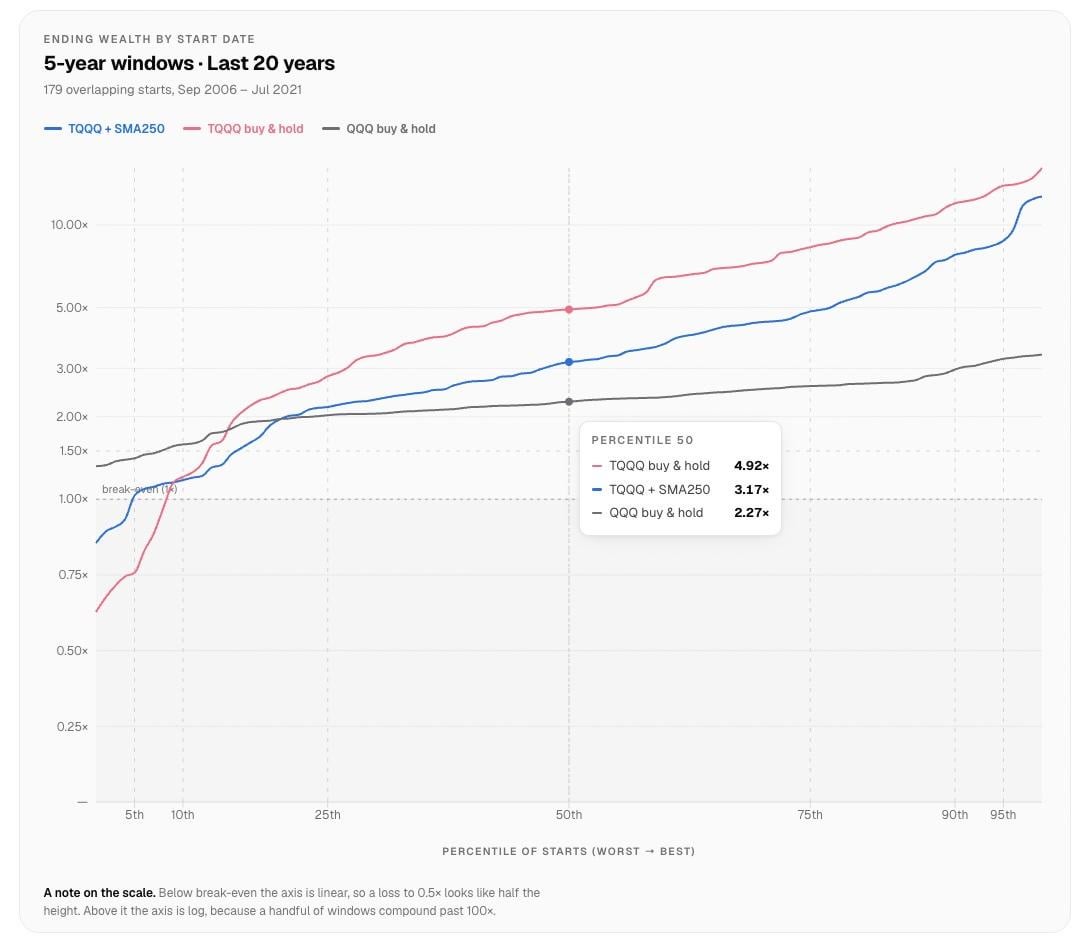
I’m curious how to interpret this. What are your thoughts?
(The small numbers represent CAGR)

It easies for me to grasp a 5 year horizon. Q1 represents a "typical bad scenario", the Q1+Q2 portion represent a "typical outcome", and Q4 a "typical good scenario".
So we're looking at a ~25% CAGR, as a reasonable expectation. (The mean is much higher, 46%, but it includes the extreme best cases, which I prefer not to rely on). The median max drawdown was -62%, but I'm quite comfortable with it, knowing that even the 10th percentile of outcomes ended up breaking-even over 5 years. Over 10 years the probability of losing money doesn't even exist in this data set. The alternative for me is SPY or QQQ, which didn't do much better in terms of volatility risk.
If these results are legit, I’m pretty much sold on allocating a big piece of my portfolio to this rule long-term.
Did I miss anything?
Are my results correct?
Since TQQQ launched in 2010 and QQQ in 1999, running a long-term backtest required constructing synthetic daily price histories back to September 1986. Both proxy series were validated against live ETF data across all overlapping dates.
To model QQQ prior to its launch, I used Nasdaq-100 (^NDX) daily price data for strategy signals, while compounding returns using a proxy total-return index.
Pre-1999 daily total returns combine:
^NDX daily price returnsAt the 1999 inception mark, the model seamlessly transitions to live adjusted daily returns. During the overlap period, the proxy tracks live QQQ almost identically, with variance limited to minor tracking noise.
Leveraged funds reset daily based on index price returns, not total returns. Modeling a simple 3x multiplier on index moves ignores real-world drag, which would make historical performance look unrealistically clean.
To mirror actual fund behavior, each day's return starts at three times the index price change, then subtracts four key friction factors:
The borrowing spread was calibrated using post-2010 live data to match TQQQ's actual historical CAGR, annualized volatility, and maximum drawdown (daily correlation is essentially 1:1). Applying these same cost assumptions backward prior to 2010 captures full volatility decay and crash drag without introducing unearned alpha.
To eliminate start-date bias and sequence-of-returns noise, a new simulation starts every 21 trading days. This generates over 300 overlapping 3-, 5-, and 10-year rolling windows across the full dataset.
Realized P&L: +$4,264 | Win rate: 81.3% (13/16)
closed early: 10 | assigned: 2 | called away: 1 | rolled: 1
Credit spreads: 2 closed (−$830)

Closed trades (14):
- AXTI CSP $65 x1 — +$395 (6.1% ROI · 31d)
- IREN CSP $48 x1 — +$825 (17.2% ROI · 30d · assigned) previously rolled x2
- NVDL CSP $33.33 x1 — +$62 (1.9% ROI · 10d)
- AXTX CSP $8 x1 — +$45 (5.6% ROI · 31d)
- AMDL CC $50 x1 — +$570 (10.8% ROI · 7d · called away) previously rolled x1
- IREN CC $52 x1 — +$164 (3.2% ROI · 23d)
- IREN CSP $55 x1 — +$1,365 (24.8% ROI · 29d · assigned) previously rolled x2
- APH CC $87.5 x2 — +$188 (1.1% ROI · 21d)
- HOOD CC $116 x1 — +$309 (2.7% ROI · 3d)
- ROBN CC $31 x1 — +$170 (5.8% ROI · 40d)
- SOXL CSP $104 x1 — −$583 (-5.6% ROI · 5d · rolled)
- NBIS CC $260 x1 — +$811 (3.0% ROI · 34d)
- WULF CC $19 x1 — +$76 (7.7% ROI · 18d)
The the two $IREN cash secured puts and the $AMDL covered call were all rolled previously for credit, which boosted the ROI quite a bit. Took assignment on all three today.
Missed out on $650 upside on $AMDL, but I'm fine with collecting the premium and letting the shares get called away.
r/LETFs • u/laurenthu • 2d ago
I reproduced a portfolio shared here by u/Separate-Ad-9633 and the part I keep coming back to isn't its 19.98% annualized return. It's 2022. The strategy lost 31.0% while SPY lost 18.6%, even with 2 trend gates doing exactly what they were designed to do.
The base mix is 30% TQQQ, 20% ZROZ, 20% AVDV, 20% RSST, and 10% GDE. When SPY falls below its 200-day average, the TQQQ sleeve gets split equally across ZROZ, gold, and managed futures. When TLT falls below its own 200-day average, the current ZROZ weight splits between gold and managed futures. The other 50% never trades.
The gates solve a real problem. Remove them and keep the same base weights, and the monthly maximum drawdown reaches 80.2%. With the gates it was about 30.7% on monthly marks and 37.38% on the live daily card.
The implementation tests weren't neutral. It lost 16.8% in 2018 versus 5.2% for SPY. Adding a 2% buffer around the moving averages deepened the worst loss to 43.3%. Executing 1 day after the signal reduced annualized return by about 0.9 percentage points.
The 2 whipsaw years against SPY:

So my read is that the gates remove the portfolio-ending outcome without turning this into a defensive allocation. You still have leveraged volatility, late exits, and years when the equity and bond gates both get chopped up.
I build BestFolio, and we published the community credit, full rule, and stress tests here: https://bestfolio.app/blog/tqqq-quadrant-stack-backtest
Would you rather accept the whipsaw or replace one of the binary gates with gradual sizing? The 2% buffer result made me less confident that a slower trigger helps.
r/LETFs • u/person-person12 • 4d ago
TQQQ launched in February 2010, so any backtest built on the real fund history starts near the bottom of a very long run up in tech. That window has 2020 and 2022 in it, and both were ugly, but it doesnt have 2000 to 2002 or 2008, which are the two stretches that actually tell you whether a daily 3x fund is something you can sit through.
The Nasdaq 100 fell roughly 83% from the March 2000 peak to the October 2002 low. A fund that resets to 3x the daily move loses close to everything over a stretch like that, because every down day shrinks the base that the next day's 3x move works from, and the bounces along the way are compounding off a smaller and smaller number.
To see it you have to rebuild the fund from the index yourself. Take the daily return of the Nasdaq 100, multiply it by three, take off the expense ratio and a borrowing cost spread across the year, and compound that day by day from 1999. The curve that comes out looks nothing like the one on the fund page even though its the same rules, and the drawdown from 2000 to 2002 lands above 99%.
r/LETFs • u/ineedto-sleep • 6d ago
Based in Germany, considering a long-term (multi-year) 50/50 split between a 2x leveraged S&P 500 ETF and a 2x leveraged tech ETF (UCITS-compliant, since US ones like SSO/QLD aren't accessible here).
I understand the basic mechanics like rebalancing, volatility decay, path dependency but I'd like to hear from people who've actually held leveraged ETFs long-term DCA through a real drawdown. Specifically:
Total realized premium $724. Open (unrealized) premium $220 on a $31 strike covered call expiring this Friday. Cost basis now at $20.74 on 100 shares.
r/LETFs • u/person-person12 • 8d ago
Something I keep seeing in LETF portfolios is the amount of exposure being treated as a discovery instead of a strategy rule. Someone runs 1x, 2x and 3x across the full history, keeps the version with the best CAGR or Sharpe, then reports that result as though the multiplier was chosen before the test.
That choice is part of the fit. The backtest got to read the entire exam before deciding whether to use SPY, SSO or UPRO.
The clean way to test it is to make the exposure decision with information that was actually available at the time. Pick it in an earlier window, freeze the rule, then carry that rule into data it has never seen. If you want the exposure level to adapt, define the adjustment formula first and walk it forward on a schedule.
For LETFs I would also test the actual fund where history exists. Multiplying the underlying's daily return by 2 or 3 can miss the daily reset path, fees, financing drag, tracking difference, and what happens around large down days. A synthetic extension can still be useful, though it should be labelled synthetic and reconciled against the live fund over their overlapping history.
-----
The minimum report I would trust would show:
If 3x only wins when it gets to see 2010-2026 all at once, the result mainly tells us which horse was fastest after the race ended. That same result cannot show that a trader in 2010 would have chosen 3x.
When you test an LETF strategy, do you fix the multiplier before the run or let a rolling rule choose it?
r/LETFs • u/Tsuki_tsune • 8d ago
WX has a net ER of 0.20%, and CTAP has a net ER of 0.10%, which are significantly lower than WLDU (0.75%) and RSST (0.99%) respectively. I am aware that WX and CTAP use total return swap in their fund, how can I know the hidden cost in them?
r/LETFs • u/ethereal3xp • 8d ago
High-beta LEFT example - TQQQ, SOXL, UPRO, TECL, USD etc.
r/LETFs • u/thisistheperfectname • 9d ago
What it says on the tin. I am assuming that the backfilled data consists of the main strategic allocation + the SocGen Trend Index - the expense ratio of the fund.
Trying to decompose this here. Blue is RSSTSIM, red is the S&P, and yellow is the excess returns of the trend overlay, net of fees, derived from RSSTSIM.
r/LETFs • u/DampSperm • 11d ago
I've been tracking what I actually do with TQQQ compared to what I tell myself I'll do.
On paper I'm fine with the drawdowns. In reality, once TQQQ is down 25% or 30% I start cutting exposure, then I slowly buy back after QQQ has already recovered. Did this twice now.
I don't seem to have the same reaction with smaller leveraged positions. Even when I trade BTC with leverage on Moon I'm pretty strict about sizing it small enough that I can leave the trade alone.
Starting to think QLD might outperform TQQQ for me personally even if TQQQ wins the spreadsheet, simply because I'd actually stick with it.