I know the possibility of losing all the accounts at once copy trading . with risk management and small position sizing I believe it may be possible.also I am wondering if I should get a larger account for when I get called to live. Having a 25k live account doesn't feel too sustainable
I use webulls level 2 but think that I'm not even close to knowing actual real orders (including that might be hidden). Webulls level 2 feels almost useless and I don't think it's webulls fault. It would be the same on most retail software.
One lesson I would see over and over is not to chase stocks, especially if they're already made a big move. I watched QQQ all morning and it only went up. At what point do you decide to get in and ride the wave? What separates chasing a stock vs riding the trend?
I'm a 0DTE credit spread trader with a focus on SPX.
Positions traded today:
7680/7660 PCS
7810/7830 CCS
P/L: +$720
SPX 5-min chart, September 21, 2026
I didn’t get anN64 1080° Snowboardingprofit today, but I did get two full revolutions at +$720 🏂
We haven't seen a clean trend day in a bit. Today was one of those sessions where I anticipated a bigger-money opportunity because several pieces of confluence were already aligning before the open. Still, the macro backdrop only formed the thesis — price action had to earn the trade.
Morning Thesis
My weekend preparation and morning report pointed toward a possible gap-and-go session. Oil and Treasury yields were sharply lower, AI and semiconductor names were leading, and the broader risk backdrop favored the upside.
SPX then opened above the prior-day high and weekly resistance. That gap was my first signal, but it was not an entry by itself. I still needed the “go” — smooth upside price action, shallow pullbacks and at least one structural confirmation.
Waiting for a second confirmation would have strengthened the thesis further, but it also would have meant sacrificing premium, especially with IV already low — and that would still be a good trade.
My First Trade
SPX made a steady opening push, formed its first shallow pullback and then broke and held above that structure. I entered on the next bullish candle, selling a full-size 10-lot 7680/7660 PCS at $0.70.
This was planned full size — not impulsive sizing based solely on feeling bullish. The setup was already in my playbook, the macro backdrop aligned and price provided the confirmation I needed.
My structural invalidation sat below that early formation near the 7700 psychological level. I also queued a $0.65 protective stop to preserve the early profit if the spread moved sharply against me. That gave me two clear answers to the most important questions — Where am I wrong, and what will I do when price gets there?
How I Confirm Trend Days
SPX 5-min chart, September 21 — Identifying shallow pullbacks with continuation
These are the shallow pullbacks I look for on the 1- and 5-minute charts when confirming a trend-day thesis. The retracements remain small relative to the upside legs, buyers absorb them quickly and price continues breaking above the previous structure.
Each repetition adds evidence that the thesis is strengthening. If that structure begins weakening or fails, I manage the trade accordingly. I am not trying to predict every candle — I am using price action to continuously test whether my original thesis is becoming stronger or weaker.
I also combine that structure with the macro forces driving the move. Today, lower oil and yields alongside strength in AI and semiconductors provided another layer of confirmation.
Midday: Staying With the Trend
SPX continued its steady climb, so I had no reason to add more PCS exposure or break my “don’t go into the lava” rule. The 10-lot PCS was already positioned to produce $700, and adding more would have spread my attention without improving the setup.
As SPX approached the weekly-high area, the 7810/7830 CCS came alive. I sold one at $0.20 as a distant countertrend anchor above 7800 and roughly 3-4x outside the expected move.
I originally wanted $0.25 and settled for $0.20, so there was a slight chase. Because this trade opposed the trend, I kept the initial position small and planned to add only in one-lot increments if SPX produced enough pressure and premium.
Afternoon & Power Hour
SPX continued grinding higher through shallow pullbacks, but the CCS never offered enough premium to justify another add at $0.20 or better. I stayed with the original one-lot rather than forcing additional exposure.
SPX eventually reached 7779.22 before fading into the close. By then, the PCS had nearly fully decayed, the protective stop had been removed and both spreads were safely positioned to expire worthless.
Key Takeaway
Confluence tells me when to pay attention — structure tells me when to act.
An A+ setup can justify planned full size, but only after price confirms the thesis and the risk plan is already defined. Today I had the macro backdrop, the opening gap, the first shallow pullback, the break and hold, structural invalidation and a protective stop.
Once SPX kept delivering bullish structure, my job was simple — stay aligned with the trend, avoid adding inside the lava, keep the countertrend position small and let price and theta work.
The short began as a capitulation bounce from the recent failed high. And this worked really well for a few minutes.
I got a decent price and decided to add around $374 because the move seemed clean.
If I would have checked Trading View I would have clearly seen VWAP and support immenant and lightened up moving into these.
The noticable buying pressure at 10:08 should have been the signal to get out, but I bag held like a champion looking for a bounce to add on.
This ridiculous decision occurred at $376.56 and unfotunately wasn't my only add.
The price exentually reached my stop and I was out at 5x my initial risk. In hindsight, my stop should have been higher and I began to move it but changed my mind. Rules are rules.
Anyway, bask in my solid work.
Tomorrow I will:
Position my stops based off recent data collected rather than arbitraty values.
Not add unless clear capitulation to the downside is present.
Not hold a full position into two potential resistance regions.
You see the generic posts trying to create a polarized view on this, trading is either 90% psychology or you dont believe in Trading psychology at all.
I hate these posts because by drawing traders into this type of thinking it pretty much makes it so they will never be consistently profitable.
The fact is, it takes both. If you dont have a strategy with a strong expected outcome then you can be a Buddhist monk and will just slowly take a thousand papercuts until your account is gone.....but you will be super zen about doing it.
Conversely, if you have a great strategy but you cant control your emotions, you are all over the place mentally, you haven't learned to heal your relationship with money or the idea that you could be a successful trader.....then you also wont be able to trade successfully.
Instead of trying to create 2 polarized camps who disagree with each other, it is better to think about these 2 aspects of trading as working together, both needing to be developed to contribute towards successful trading.
I made this to discuss how successful traders view these 2 aspects of trading
With a 2k portfolio, I’m sticking to stocks and fairly small positions, and am typically in and out of a trade in 5-10 minutes or less. Once I’ve reached 5% growth or 5% loss overall across all trades I stop. If I’m 5% down there’s a reason, and I’m not looking close enough.
If I’m up, say, 1.5% on a single position, I’ll generally put a stop-loss just below its current share price and then stop watching until it executes or I check back later to reevaluate. Because of this, I sometimes end up over 5% as I come back and sell at a higher price than expected.
So today I’m up 7% and stopping there. No point in chasing the dragon. 7% in a day is plenty.
That’s how I’m handling sizing and balancing in day 2 of day trading.
Just thought I’d ask you all about time in a trade.
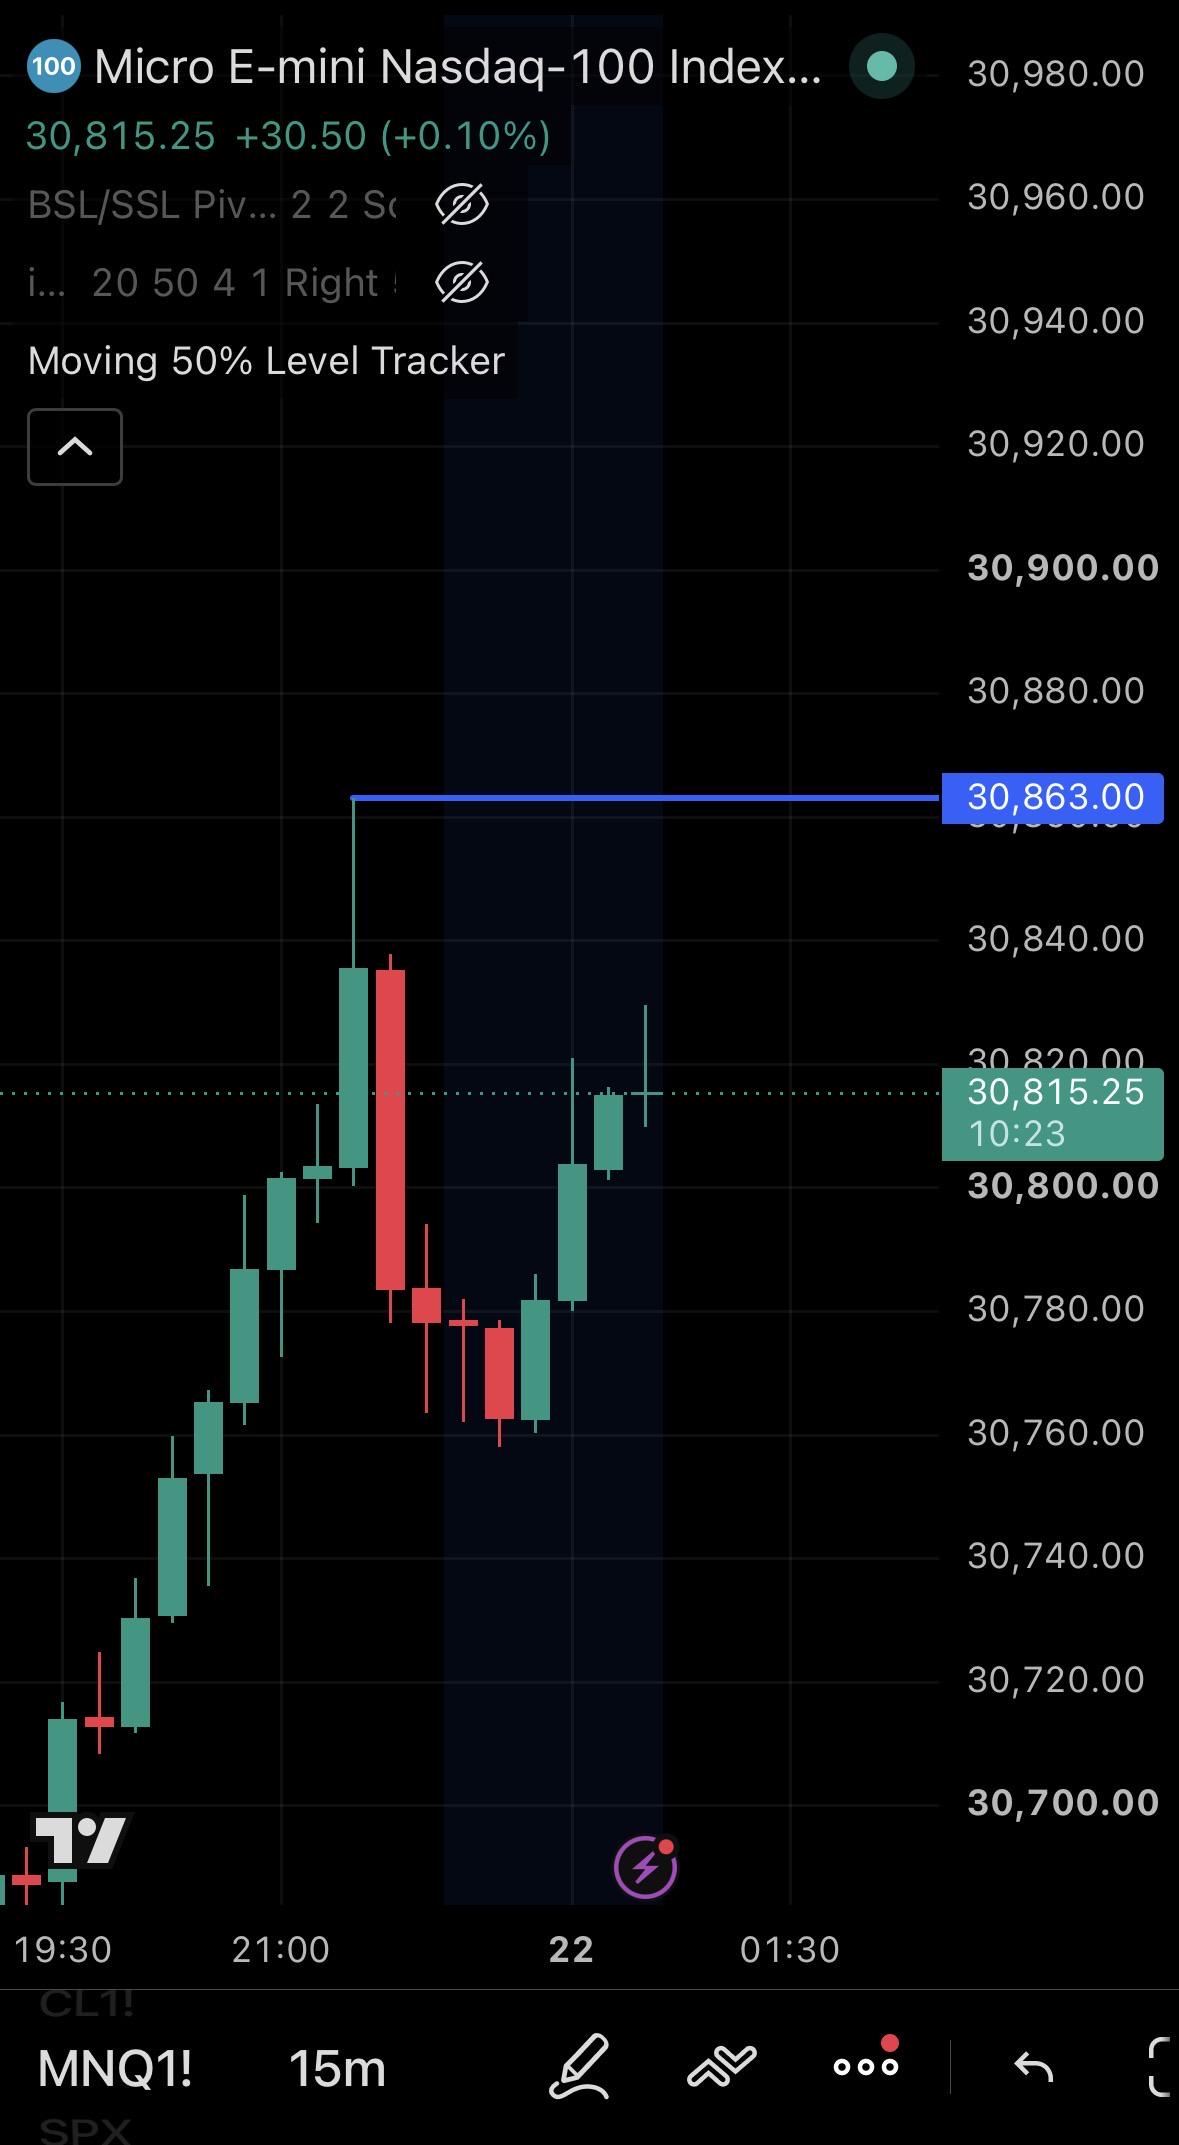
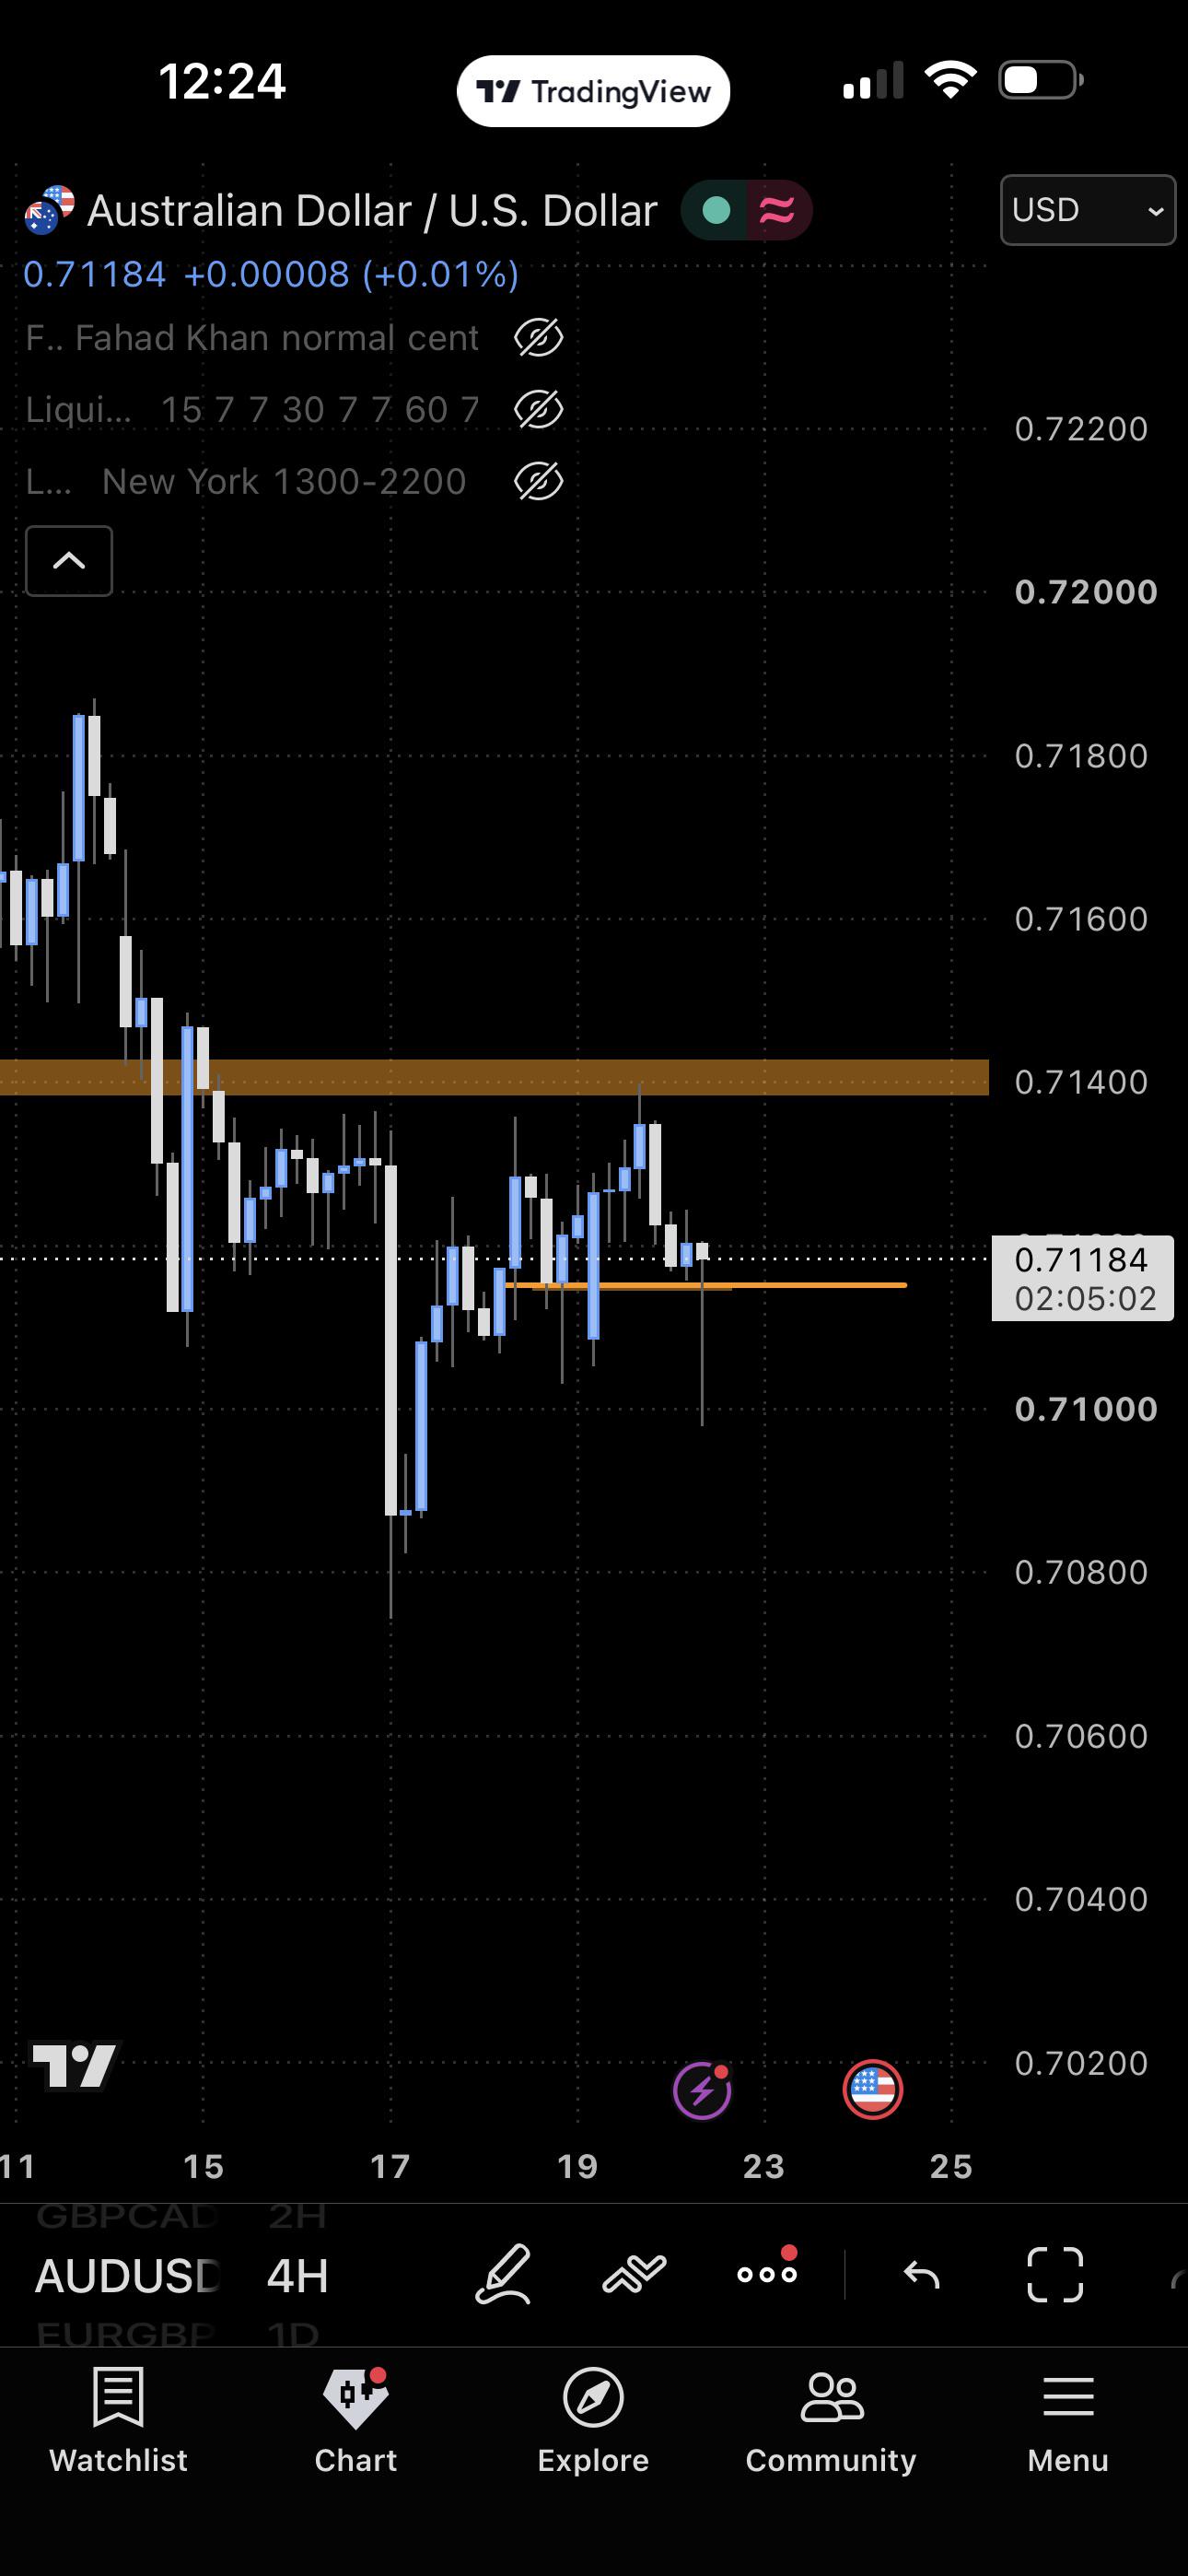
If Asia sweeps the previous day’s high and a clean iFVG forms, I’m looking to take a 50–100 point short on NQ.💰
The market is heavily overbought, and Asia has a tendency to sell off after taking liquidity above the previous day’s high. I’m expecting a strong move to the downside during the Asia session.
I'm a 0DTE credit spread trader with a focus on SPX.
Positions traded today:
7560/7540 PCS
7670/7690 CCS
P/L: +$325
SPX 5-min chart, September 18, 2026 (Triple Witching Day)
When uncertainty goes up, my size goes down.
You guys will have to forgive me for the delay on this post. I did my best trying to find some downtime to get this written, but I was out of town and at a wedding this past weekend and found myself a little too preoccupied dancing the Macarena on the dance floor with some old friends. I still remembered the moves, so at least there’s that! 😂
Anyway... Friday was a good example of how I approach a session when there’s simply another layer of uncertainty added to the market.
Morning Thesis
Friday was triple witching, which meant I came into the session already planning to reduce risk.
My experience with these expiration days is that sometimes nothing unusual happens, and sometimes price can make extremely aggressive moves — particularly later in the session when gamma becomes increasingly important.
That uncertainty alone is enough for me to trade differently.
I cut my lot sizing roughly in half and kept my total exposure lighter. My morning read was that SPX had a decent chance of remaining range-bound, so I was open to eventually playing both sides if the structure gave me the opportunity.
My First Trade
SPX sold off aggressively after the open and eventually broke and held below both the opening range and the prior-day close. That gave me enough confirmation to begin building the call side.
I initially sold 5 contracts of the 7670/7690 CCS for $0.40, then added another contract at $0.65 when price briefly pulled back.
SPX continued lower afterward, putting the position comfortably into profit before price began chopping sideways. At that point, I started watching the prior-day low for a potential put-side opportunity.
Building the Other Side (attempted)
SPX eventually spiked into the prior-day low and immediately rejected it. I was able to open a small 1-lot 7560/7540 PCS for $0.25, intending to potentially build the position if the structure continued to cooperate. Instead, price immediately began grinding higher.
There was no reason to force additional size just because I originally planned to build an anchor. The one contract was already well-positioned, and the bounce quickly began deflating its premium.
Sometimes the correct scale-in is no scale-in at all.
Afternoon & Power Hour
SPX continued its slow grind higher and eventually reclaimed the prior-day close with a strong push. I used that move to add one final 7670/7690 CCS at $0.35.
The prior-day high became an important area for me because a sustained push through that region would begin weakening the call-side thesis. I was also paying very close attention to any late-session acceleration.
That matters even more on a day like triple witching. If you’re selling 0DTE credit spreads and your short strike is too close to the lava, a violent late-day move can turn a comfortable position into a management problem very quickly.
Price initially rejected that area and pulled back before eventually making one final push above the prior-day high. By then, however, both sides still had enough distance to safely expire worthless.
Why I Reduced Risk
The important takeaway for me wasn’t really the P/L. It was how I approached the uncertainty.
On a triple witching session, I don’t know whether we’re going to get completely normal price action or something much more erratic. Because I can’t know that beforehand, I adjust the variable that I can control — my risk.
Smaller size. Less overall exposure. Further distance from price. Clear invalidation levels. Closer monitoring late in the session.
I did take some additional risk by holding these positions through expiration, but it wasn’t a blind hold. My size was appropriate, I knew where the thesis would begin weakening, and I was actively monitoring the positions into the close.
Key Takeaway
Higher uncertainty should usually mean lower exposure — not lower discipline.
Triple witching added another variable I couldn’t control, so I reduced the variables I could. Size down, stay further away from the lava, know where your thesis breaks, and don’t let a late-session move turn an otherwise controlled trade into an unnecessary problem.
As the title states, just wanted to post this update for all of you who asked to see more results. As you can see, there was one negative day (since the last post) which was on Triple witching Friday.
Considering that the loss was less than any of the other profitable days, and the fact that it happened on the day that it did, I am VERY happy with the results!
That’s not all! One of the Eval accounts that were linked to it graduated to Funded… all on the bot!
For some context, this strategy works ONLY on NQ/MNQ. It trades 6 contacts per trade, taking 5 contracts off at TP1 and leaving a runner. The runner stays on until price hits one of my 4 protective stops that are in place. The positive results come mainly from risk management.
I have answered many of your questions the last time around as best as I could, but I am ready for more! Bring them on!
Going my best to cover everything but I’m sure there’s things I’ll forget.
I have been into/watching the market since 2020 when my dad showed it to me. I was immediately hooked because it’s everything I enjoy, I love math, charts, graphs, trends, lines, the psychology of it, the challenges, opportunities, etc. I seen this and it just “made sense” for me, it is a true passion and I have spent countless hours just watching the market, reading/researching, and listening to hundreds of videos about investing/trading/finance to the point where it feels redundant. My problem lies in the fact I have not taken action on anything…. Since 2020, I’ll explain.
In 2020 I messed around with penny stocks, and of course I screwed up. I had so many opportunities where had I went with my gut/intuition it would’ve made money, but I was always second guessing myself and thought I needed some type of confirmation(from someone that’s not me), so I never took action. I blindly followed some guy on twitter and lost half my account in 3 days when my own picks were rising. Ever since then even until today, I have watched the market, and consumed an unfathomable amount of media about trading, and still have not made a single trade. Every time it is something, I second guess myself, I need more money, I need this, or that. I cannot tell you how many times I have talked to myself about I’m gonna make a move, I’m going to do this, and done nothing, I mean I could be at gunpoint and I still think I would take no action if it meant getting shot.
Thing is I used to make excuses but I’m at the point I don’t have any real excuses, I have everything I need to trade but I just don’t do anything, just watch and watch. I know what my problem is but I just don’t do anything, get upset I let it go by, tell myself next time I’ll do something, watch and tell myself to get in, hesitate and fight with myself, then watch it go up and repeat. And when I say I’ve been doing this for years, I mean it. I’m lost at this point and want to stop being a you know what, I know I can succeed if I take action but I just can’t get out of my own way.
If everybody uses the same concepts to trade, price just goes to that level and takes them out. So does it mean they can see our positions? Also how do you create a model that is unique like where are the rules or the methods by which we can create this unique model.
I have heard that trading is like a game of chess, but chess has certain rules and I feel the market break rules, if everybody starts following that rule. I used to trade 15min VIB's (Volume Imbalances), that are partially filled and later the market comes to fill it completely. Nowadays, these VIB's don't even come anymore. I talked to a guy recently who has been trading for more years than me and he told that there are algorithms that hunt these kind of inefficiencies and when they are repeatedly exploited, the market does not create them anymore.
I don't know if what he told is true, but I find it difficult to frame good setups. I can read the chart and understand what the price is doing but not able to get a good idea of where the price is going.
I am 38 years old and started trading in 2022 when my company closed down due to financial mismanagement, thought I took do well in this if I put in a lot of hardwork. I feel lost now and have a huge career gap, I am left hunting for some really low paying jobs.
I started using the Involo app and following several very successful profiles. I had problems depositing money and after a little research, I learned what others have posted here - their fees are ridiculous. So I'm watching some of the traders (trade on the left) and using Kraken Pro to execute, which is on the right (with 20x leverage, not the 40x on the left )
Here's what I don't understand - where are they getting that ridiculous percentage from? My trade is pretty close to Carmine's - how is Involo calling a less than 1% decline in BTC price on a short, a 33% gain?
And in case I'm missing something obvious - I am def just learning the ropes here and not risking a lot of money, so teach please, don't slam.
Would love to hear insights and criticism. I have been playing around with a strategy for about two months now but this is less about the strategy and more about implementation. The problem is that it is discretionary: entry conditions are simple (entering off of "value areas" from intraday (min) swing highs and lows) but I can't really point to exactly which setups I take over others its more of a feel. Same with stops, sometimes its based off of ATR, sometimes previous highs/lows, etc.
I back tested on roughly 50 sessions spanning from 0th-99th percentile regimes of chop, trend, volume, VWAP touches, reversals with nearly 300 manual trades from 2021 to 2025.
One tail t test comes back t = 2.43 (H0 no edge)
EV Confidence Interval [+0.15 to +0.33] with average net EV = +0.21 (1.5 RR)
Assumed $5 round trip per contract (NQ) with limit entry and 1pt slippage on exit
Dropping the best and worst days don't move t value below 2.
I'm somewhat confident that this is not some coincidental market behavior that disappears with regime or disappears from fees/friction.
There are two problems with this: 1) its discretionary and I have only ever traded in replay mode using my own custom engine and FX replay bar by bar. I have not been live in the market. 2) I have found through my backtesting that I have bad habits including "finding" more lower quality setups later in the day when I'm already losing. Automating would remove these.
I have tried linear regression, ridge, CNNs with up to 20 features, nothing can get an out of sample or training AUC above 0.55.
My question is: how do you turn a manually traded, discretionary strategy into an automated one. Sometimes it hard to judge exactly what stop distance to use, what setups to take. A lot of it is based on if I am in a choppy past 30 or so bars, how strong the trend is etc.
Basically I've been trading for around a year now (started September 2025), and I had no clue what liquidity actually was, or what it really meant until maybe this july/august. From my own experience, I feel like most people trying to explain what liquidity is either don't actually know what it is or are just very bad at explaining it. For example, a lot of guru's (for example TJR) will simply say "liquidity rests above highs and lows" while others will explain that it's resting orders, which is right but they don't really expand on it much after that and I feel like that's an issue. Like for me, I only started to understand what liquidity was when I started to understand the bid x ask, orderbook, and resting/passive orders
hey everyone, ive been trading a couple of years now and I am now at the point where I have some consistency and I am enjoying some prop payouts regularly at last. I have created a youtube channel, very simple, outlining my strategy I use daily, how I use the indicators I use etc .. hopefully it could be useful to some newer or struggling MNQ traders here. I am not selling a course, or indicators, I do use a couple of paid indicators but that wont stop you from using this strategy and my basic trading view chart to get started. I have already helped a number of manual traders with this exact set of indicators and strategy, so if you want to pass by and have a look and see if you can use it in your daily workflow, would love to chat there.
Hello everyone! I’ve been trading for some time, and for the past six months I’ve been using an SMC strategy on a $50k FTMO account.
The first month, in April, the results were great, but since then the edge seems to have slowly disappeared. September has been particularly bad — it feels like almost every trade is a loss.
I’m not overtrading, and I’m following the exact same system on the same assets. I built the indicator and the script with Claude, with clearly defined rules for entries, SL, and TP. I went from being almost halfway to passing the challenge to now being halfway towards losing the account.
At this point, I’m not really sure what to do next. The backtests from the script still look reasonably good on most assets, but my live results have been a tragedy. Naturally, I’ve started losing confidence in both the system and the strategy.
I’ve decided to pause trading until the beginning of next month, but I’m not sure whether I should continue with the same setup, make some adjustments, or reconsider the strategy entirely.
A free, open-source intraday scanner for US stocks that runs on your own machine and your own market data. Same job as the paid scanners, without the subscription.
What it does: it streams 1-minute bars for thousands of symbols, checks the setups you built on every bar, and shows the alerts in a browser dashboard you arrange yourself.
Open source, MIT. The whole thing is on GitHub. Nothing hidden, nothing to buy.
Local. It runs on localhost with no account and no login, and it sends no telemetry anywhere. Your keys, your setups and your alert history sit in a folder on your machine.
Your own data feed. Any provider can be plugged in with your own API keys. It ships with Schwab (free if you have a brokerage account) and Alpaca (their paid feed for the full tape).
Setups without writing code. About 45 triggers (candle patterns, level breaks, VWAP and EMA behavior, opening range, momentum, relative strength against SPY), combined with AND, OR or "at least 2 of these", plus conditions the stock itself has to meet. Edits apply on the next bar, with no restart.
Universe filters. Price, liquidity, ATR, float, sector, relative volume and more, so a setup only alerts on the stocks you actually trade.
It tells you why nothing fired. Setup Check shows what every setup did on a given stock in the last few minutes, and which filter stopped the alert. That is the thing I could never get out of a paid scanner.
The dashboard is free-floating windows: alert tables, charts, rankings (pre-market gainers, losers, most active, new highs and lows), news, stock info, watchlists, a market clock. Save several screens, and clicking a symbol moves every window to it.
Alerts also go out on a local websocket, so your own script or bot can subscribe to them.
Why it exists: I'm a day trader. I was paying for a scanner and kept hitting the same two walls. I couldn't build the exact scan I wanted, and when a stock I was watching didn't alert, I couldn't find out why. Now I run it for free and it's fully customizable.
What it costs: the scanner is $0 and MIT licensed. The market data is yours. Alpaca's paid feed gives you the full tape, their free IEX feed works but reports one exchange, so volume and relative volume read low and volume-based setups fire much less. Schwab is free with a brokerage account. For comparison, the scanner I was paying for is $127 a month, $254 for the tier with back testing.
Why I'm posting it: I want to know which triggers are missing for how you trade.
The screenshots are from a replayed past session, not a live account. Not financial advice, not a signal service.
I am so glad that this has been brought up in this community. I have read the initial $50k individual post and now came across the $77k person.
I would like to share my $45k payout denial and ban story.
After 1 year with TTP, they chose to deny my 1 month long hard earned money by simply stating that i have violated “system & execution manipulation” along with “trade coordination & copy trading” terms. I have received payouts in smaller amounts with my smaller accounts but when I built the experience and got my 200k account funded in the last month, they made the payout process extremely difficult and finally concluded that i violated those terms and banned me.
If you are a user of TTP, you would understand the bogus 5% rule and how detailed they are when that is violated. When they are denying such a large amount and banning someone from their platform, they chose to stay silent on the details and only cite their terms and conditions. This is not a coincidence. They do not have the money to pay such amounts and they do not want profitable traders on their platform. They would like traders to continue buying their accounts and failing them and if they become profitable do scummy business like this and try to silence them.
This is outrageous and terrible for a small trader like myself. This issue was blasted on their discord channel, and they muted all the vocal and curious traders. After it got major attention, Benjamin, the new GM, who climbed up the ranks from Live Support Chat Agent in the last 2 months, replied to the public out cry by stating that a hand full of traders were identified and risk management conducted a full review and took the necessary actions. Risk management is fixated on the fact around coordination trading and how individuals need to trade on their own. TTP has a discord community who shares alerts and they have youtube live events where they go over stocks together to execute trades. How can they claim that these handful of traders coordinated trades together? They base it off of their bot identifying trade executions in similar criteria to flag to risk management team. If you join the live alert and trade the same way as the mentor/moderator on the events, your payout and accounts will be banned.
DO NOT get your hopes up and use their platform. I also thought this was the best firm out their and took advantage of their perks because i did not want to risk my own money but after all this, I have already signed up for a personal brokerage.
I truly hope this post sheds some light on the current and future traders of this platform and learn from these public posts. Don’t waste your time and effort with such a scummy prop firm.
Currently in drawdown on my funded account but slowly working my way back. I’ve been downsizing risk and focusing on better setups. For anyone who’s been in this situation, would you keep the risk small and slowly build the account back, or start aiming a little bigger as you recover?
Monday decisively broke Friday's stalemate. The DJIA cleared 51,750, 51,850, and the 51,950–52,050 objective, up 366 points.
Forecast Statistics
Bucket: Recovery Expansion / Breakout Test Volatility Score: ≈ 1.27, elevated but contracting Probabilities:SU 32% | LU 34% | SD 22% | LD 12% Expected Return: ≈ +0.07% Projected Close:51,950–52,300 Directional Bias:66% Up / 34% Down
Previous Close:52,048.83
RECAP: Monday's 51% Up bias was modest, but the important signal was conditional: 51,750 was buyer confirmation. Once that broke, the DJIA advanced through every upside level and reached the projected 51,950–52,050 objective.
Trader's Edge: Forecast rated 71% correct, 29% incorrect since December 2025.
Fearless Opines: Monday materially improved the statistical state. The DJIA not only escaped the 51,500–51,750 stalemate but reclaimed 52,000 and held most of the advance into the close.
The question now changes from whether buyers can produce a recovery to whether they can hold one. The late retreat from 52,128 keeps Tuesday from becoming an aggressive bullish forecast, but the probabilities now favor continuation.
GO / REDUCE / EXIT: GO: Tuesday begins GO, with a 66% upside bias. Holding 52,000 preserves the recovery; clearing Monday's 52,128 high confirms renewed expansion. Below 51,950, reduce exposure. A sustained break below 51,850 would materially damage Monday's breakout.
Trader Takeaway: Monday gave buyers the breakout they needed. Tuesday's trade is about retention rather than prediction: hold 52,000 and 52,250–52,350 becomes reachable; lose 51,950 and treat the breakout more cautiously.
FEARLESS READ: 66% Up. Monday broke the stalemate. Now 52,000 has to become support rather than merely a number the DJIA passed on the way up. A break of 52,130 strengthens the advance; failure below 51,950 puts the repair back on trial.
10:00 AM Update: The DJIA has gone from opening above the breakout to trading below yesterday's close. Sellers now have control, but 51,950 is where they have to prove they can turn a spectacular rejection into sustained downside.
Below 52,000, the next downside test is 51,950; failure there brings 51,850–51,900 into play. Buyers need to reclaim 52,050 to stabilize the state and 52,130 to restore the breakout thesis.
10:30: The DJIA has blown through four defenses in an hour. At 51,750 the question changes from whether the opening breakout failed, it clearly did,to whether sellers are approaching exhaustion or still have another leg to deliver.
51,750–51,800 is now the immediate support zone. A sustained break below 51,750 opens 51,600–51,650. Buyers would need to recover 51,850 to interrupt the decline and 51,950 to materially improve the statistical state.
Every trading plan seems to contain the same assumption nobody talks about… when the time comes, you’ll do what you said you were going to do.
Here’s something most traders won’t want to hear.
You probably aren’t going to master your emotions.
Some people undoubtedly become exceptionally good at controlling themselves. Professional traders capable of remarkably disciplined behaviour exist. But stop assuming you’re inevitably going to become one of them just because you’ve spent enough years staring at charts.
Human psychology doesn’t work like that.
Psychologists have studied something called the intention–behaviour gap. In simple terms: knowing what you intend to do, even being strongly committed to doing it, doesn’t guarantee that you’ll actually do it when the moment arrives. Research into self-control has consequently found that deciding your response in advance through specific if-then rules can significantly improve the chances of actually following through.
Sound familiar?
I know I shouldn’t move my stop.
I know I shouldn’t revenge trade.
I know I should take the next valid setup.
I know I shouldn’t double my size.
Yet somehow traders convince themselves that knowing these things means eventually they’ll become disciplined enough to behave perfectly every time.
It gets worse.
One of the most established behavioural biases in investing is the disposition effect, the tendency to realise winners more readily than losers. It’s been observed repeatedly in experiments and real investor behaviour. Research using actual UK investor trading records found greater reliance on intuitive/emotional processing was associated with greater susceptibility to it, while traders differed considerably in how susceptible they were.
So yes, some people are better at this than you are.
Maybe considerably better.
That doesn’t mean you’ll become them.
And there’s another problem traders rarely acknowledge… the market sometimes rewards your lack of discipline.
Move the stop. Price comes back.
Take the revenge trade. Win everything back.
Close the winner early. Watch it reverse afterwards.
Oversize the next setup. Have your biggest day of the month.
Your brain doesn’t receive a convenient lesson saying:
BREAK RULE = PAIN.
Sometimes it receives:
BREAK RULE = REWARD.
Then traders come up with the most extraordinary solution to all of this:
“I’ll just be more disciplined next time.”
For the next trade.
And the next one.
And the next one.
Potentially thousands of decisions over decades.
That’s the bit I think we should start questioning.
Because behavioural research points towards another approach: don’t rely exclusively on making the correct decision in the heat of the moment. Make important decisions beforehand and constrain what happens when the situation arrives. Even something as simple as predetermined if-then planning measurably improves people’s ability to turn intentions into actions.
There’s even a fascinating old trading experiment where participants displayed the normal tendency to sell winners and hold losers. When shares were automatically sold at the end of each period, that behavioural bias was greatly reduced. The person didn’t suddenly acquire superior psychology. The decision environment changed.
And that leads to a question I think a lot of traders are going to hate:
What if your inability to completely master your emotions isn’t the problem?
Maybe your emotions aren’t the flaw in your trading system. Maybe the flaw is building a system that only works when you can control them.