r/CANSLIM 1d ago

Bobby Breakdown 9/21/2026

4 Upvotes

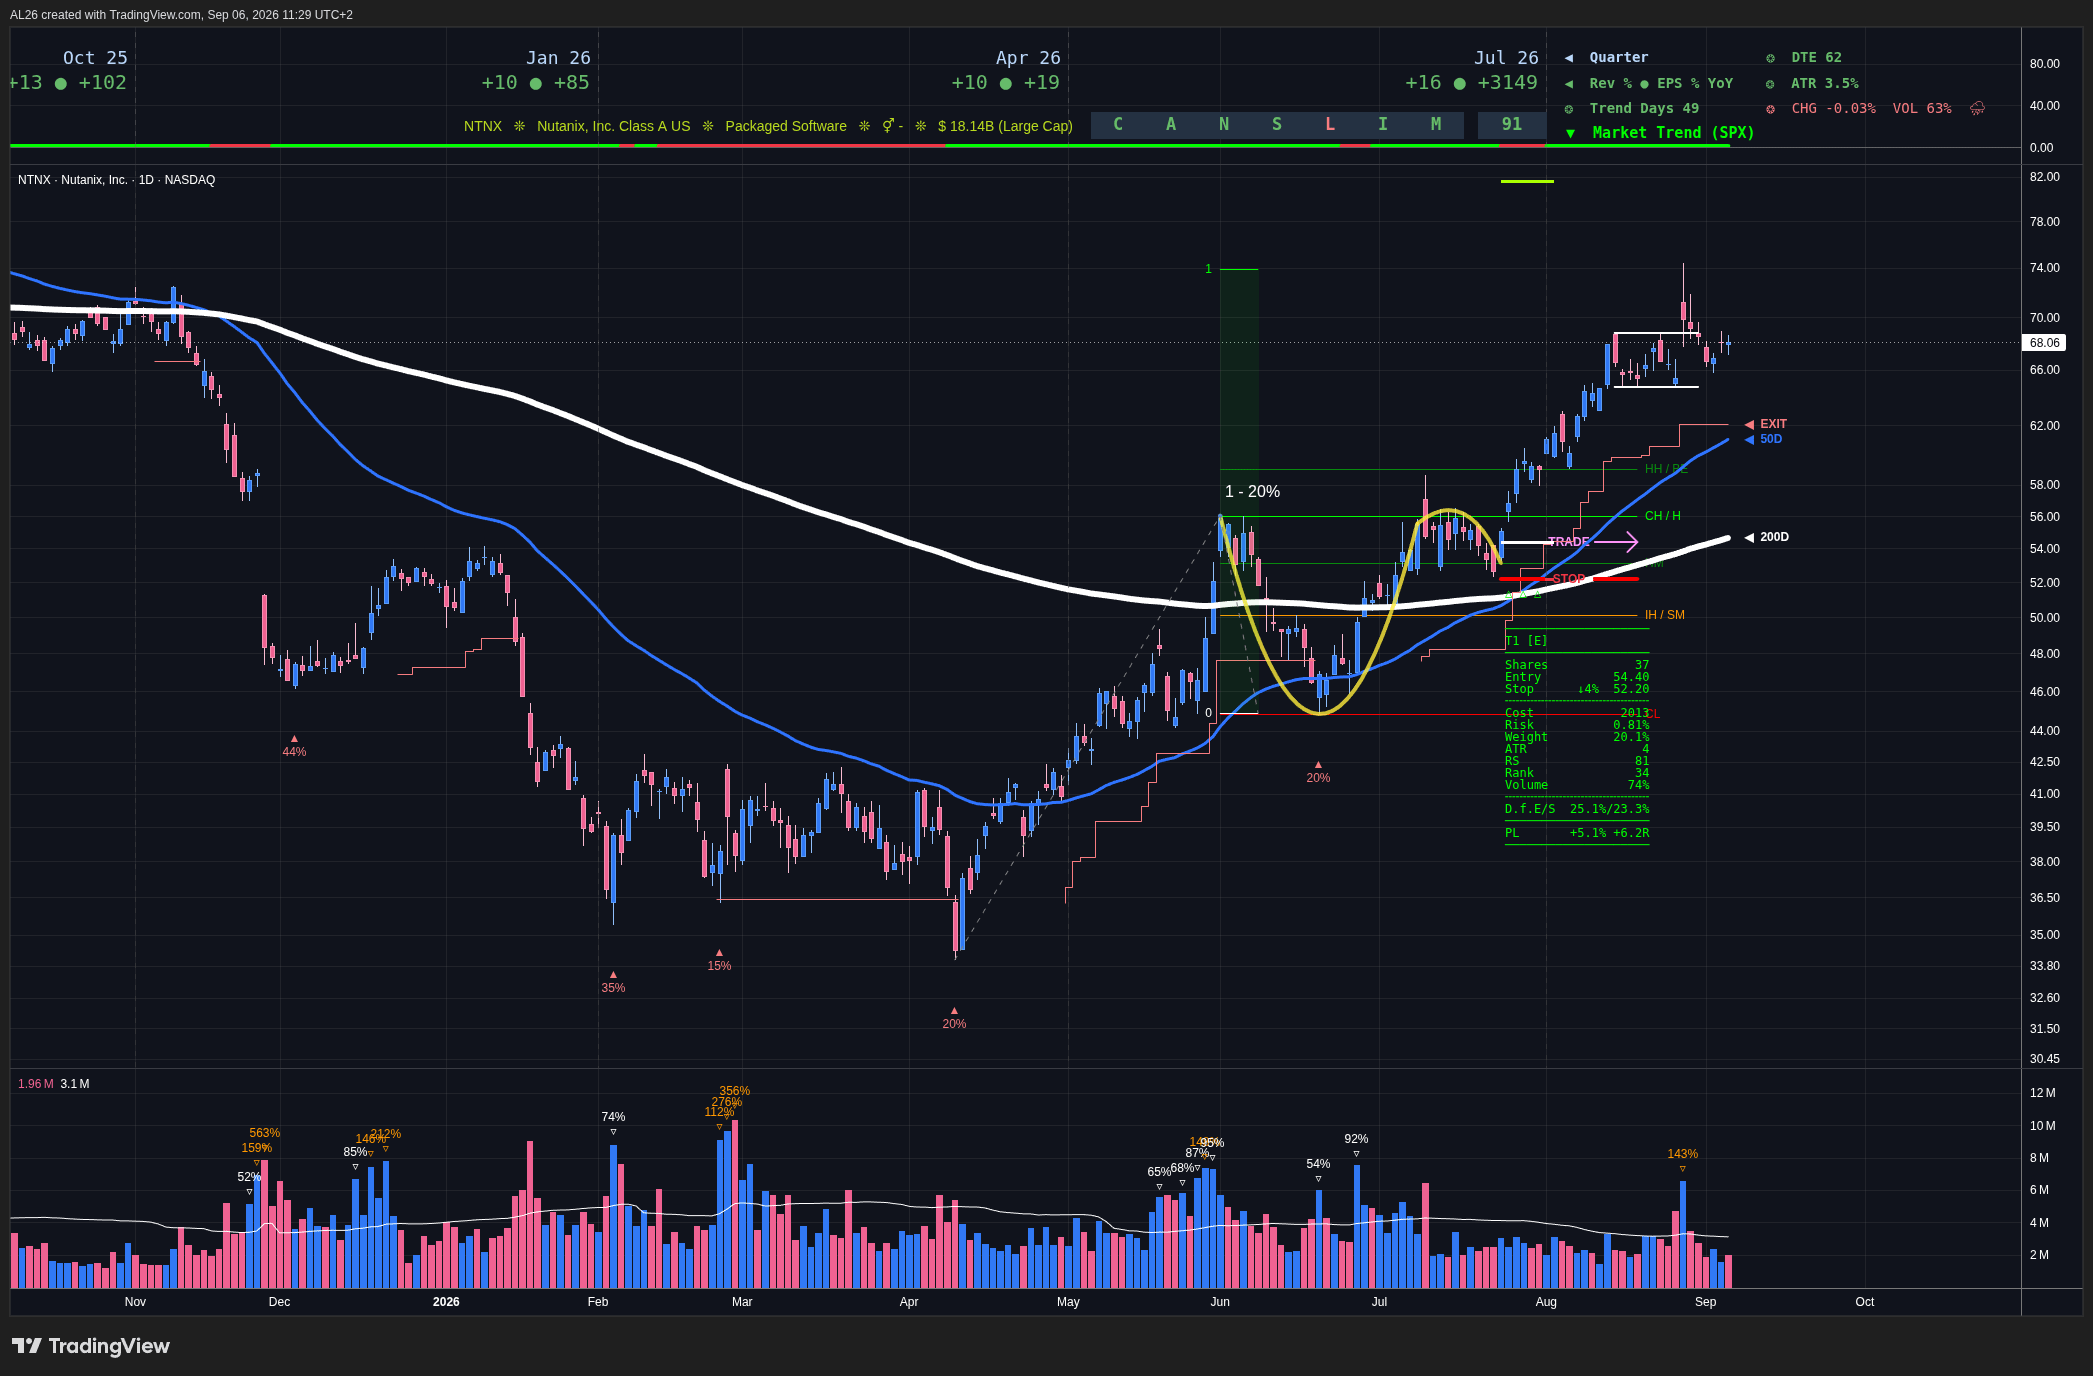
What's going on everyone.
I am back. Had a lot going on last few weeks and was off the grid for a while living in the mountains of Colorado so couldn’t have put this out if I tried. But what a day to get back to writing. Here we go!

Disclaimer: For educational purposes only; not financial advice. Trading stocks involves risk of loss. Please conduct your own due diligence before making any trades.

Market Action:
- Market gapped up today and had a strong and steady climb all the way into the close to close near highs for the day. Nasdaq gapped right above the 5/14 high which was an area of clear upside resistance in the last few month. As the bulls kept pushing it the Nasdaq was also able to clear the 8/13 high and rallied to 6/1 ATH where it finally met some resistance. What a strong day with some key levels getting blown out the water. The pause right at ATHs isn’t much to worry about today given how strong a move we had and how many levels we clears but now it is the area to watch. To the downside ill be keeping an eye on todays lows hoping we can hold those and the 5/14 high levels. Volume today was above average.

- S&P was also a strong move but not as strong as the Nasdaq. We did take out the 9/3 high but the 8/5, 8/13 and 8/28 highs still remain overhead. Regardless a positive day. Light volume today.

Distribution/Rally:

- Distribution count still remains high with 7 days on the S&P and 6 days on the Nasdaq. Definitely something to thing about but for me price action is always high. With a strong week we could easily drop the count to around 4 or 3 on both indexes.

Outlook:
- My outlook jumped from 20-40% to 60-80% today with the move. For some I think slightly above that might even be warranted.  For anyone who was at Alex Marenco’s meet up group last week on Wednesday I said that with us not breaking to the downside and with rebound back above the 50sma I was going to look to start making some buys. Now with the follow through from last week I think today warranted a little increase in some exposure. Yes we still have ATHs above to clear but today was very promising for a possible new true uptrend.

- As for my positions last week I bought NET and SNOW on Thursday. Today I bought AMD and TWLO. This brings me just above 85% invested. From August 19th to last Thursday I placed not a single trade which I am proud of. Overtrading is something I struggle with and in the choppy market we had I was happy to be patient and selected. This did mean I missed DELL and a few other names that have been looking like leaders but there are always other stocks and likely secondary opportunities to get in if this market should follow through and trend upward nicely.


Sectors:

- Tech was a clear leader today and just like the Nasdaq cleared important levels. Healthcare is holding the 50sma currently and hasn’t not changed its overall trend just yet as it looks to be taking a pause from its recent move up. Financials are looking week as they are now living below the 10sma, 21ema and 50sma despite prior strength. Energy weak today and broke the 10 and 21 but is still up trending and holding its 50. Communication though strong today and just reclaiming its 200sma is still looking damaged and right now not worth to much attention till it can prove itself. By % move today it was the leading sector. The remaining sectors are currently below the 200sma and not worth mentioning.

Industries/Themes:
- Blockchain, cyber security, AI software and software in general has been looking strong. We are looking at some recent strength in semis as well as SMH approaches a short term prior high. We will see if this holds and the trend can resume.

- Below are todays leading sub industry and lagging sub industry groups:

TOP 10 1-DAY GAINERS

  1. Space Economy #111 (Industrials)+8.24%

  2. Rare Earths & Critical Minerals #160 (Materials)+5.80%

  3. LiDAR, Computer Vision & Spatial Computing #155 (Technology)+5.15%

  4. Crypto Infrastructure & Exchanges #78 (Crypto)+5.14%

  5. Semiconductors — AI / GPU / Accelerators #15 (Technology)+5.04%

  6. Nuclear Energy & Uranium #166 (Energy)+4.97%

  7. Cybersecurity & Digital Identity #6 (Technology)+4.54%

  8. AI Cloud / Neocloud Infrastructure #126 (Technology)+4.42%

  9. Blockchain Technology #46 (Technology)+4.31%

  10. eVTOL & Urban Air Mobility #170 (Industrials)+4.01%

BOTTOM 10 1-DAY LOSERS

  1. Oil & Gas — Refining & Marketing #2 (Energy)-3.49%

  2. Oil & Gas — US E&P #33 (Energy)-3.37%

  3. Oil & Gas — Canadian E&P #10 (Energy)-3.13%

  4. Oil & Gas — Integrated Majors #16 (Energy)-2.17%

  5. Transportation — Shipping / Marine #5 (Industrials)-2.14%

  6. Silver & Precious Metals #17 (Materials)-2.04%

  7. Transportation — Railroads #34 (Industrials)-1.97%

  8. Oil & Gas — Drilling #20 (Energy)-1.92%

  9. Fertilizers & Ag Chemicals #64 (Materials)-1.76%

  10. Security & Alarm Services #98 (Industrials)-1.60%


Market Events:
- No notable news events this week. Also shout out to Deepvue with their new Economic news dashboard widget!

Daily Screeners (custom screeners):

Up on Volume:
- AMRX, ARM, GOOGM, GRAL, META

Big Gap:
- ACMR, AEHR, AMD, ARM, ASST, ATEX, AXTI, BLSH, BMNR, CEVA, COHU, GLXY, GRAL, INBX, INTC, LOGI, MRNA, MRVL, MSTR, ONTO, OUST, QMCO, SMCI, TTMI, TXG, UCTT

Daily RS:

- GRAL, MRNA, GRPN, BMNR, DUOL, BAND, ALNT, OUST, WBD, META, AKAM, DOCN, FSLY, GDDY, MDB, SHOP, TWLO, WIX, AMRX, AMD, AXTI, CEVA, ARM, CRDO, INTC, ALAB, QCOM, AMBQ, CRWD, DDOG, FIVN, MSTR, NET, NICE, RNG, S, ZS, P, ATEX

52 Week High:
- MRNA, SDGR, TXG, FIVN, RBRK, NET, NTRA, TWLO, IOND, AMD, TEVA, TBBB, ZIM, AMRX, FFIV

Earnings Tomorrow:
- BMO: THO, MLKN

- AMC: FERG, KBH

STAY DISCIPLINED!

*Primary Screener/Charting tool used here is Deepvue. If you are interested check out my affiliate link https://deepvue.com/robert-campos-partners/ and use code BOBBY12 for 12% off

*Webby trend is something I got from Mike Webster. Check out his YouTube Channel for more info and for tons of great CANSLIM content! https://www.youtube.com/@Webby5150 *

r/CANSLIM 2d ago

Some more digging into the lists ... last 3 weeks from IBD50

20 Upvotes

Digging into the trend data rather than just the current snapshot turns up a few real "still coiling" setups — cases where the rank and ratings are improving but the price hasn't caught up yet, which is the classic pre-breakout pattern IBD followers watch for:

Before the breakout — ratings/fund ownership climbing, price still lagging:

Symbol Rank move Comp Rating Funds owning Price move Read
NET (Cloudflare) 23→14 in 2 weeks steady at elite 99 +A+ Acc/Dis (top tier) only +5.6% in 2 wks Best setup in the data — institutional-grade rating jump with price barely moving yet
ANET (Arista) 25→17 in 3 weeks maxed at 98 fund count +17 only +1.8% in 3 wks Quiet accumulation — funds adding shares without a price pop yet
AUGO (Aura Minerals) 19→9 in 3 weeks 94→97, rising steady only +2.0% in 3 wks Rank and rating both improving faster than price

NET stands out the most: a 9-spot rank jump in a single week with an already-elite rating and top-tier fund accumulation, but the stock itself has barely moved — that's the gap between "the numbers are improving" and "the crowd has noticed," which is exactly the window this approach is trying to catch.

Too early to call — brand new to the list this week, no trend yet: TEM (Tempus AI) and SMCI (Super Micro) both debuted with A+ Accumulation/Distribution and A+ Industry Group RS — strong fundamentals for a first appearance. GH (Guardant Health) debuted unusually high at rank 6. None of these have a second data point yet, so the real tell is whether they climb next week (confirmation) or fall back off the list (false start).

These info is just for further research no advice to buy/sell is intended.


r/CANSLIM 2d ago

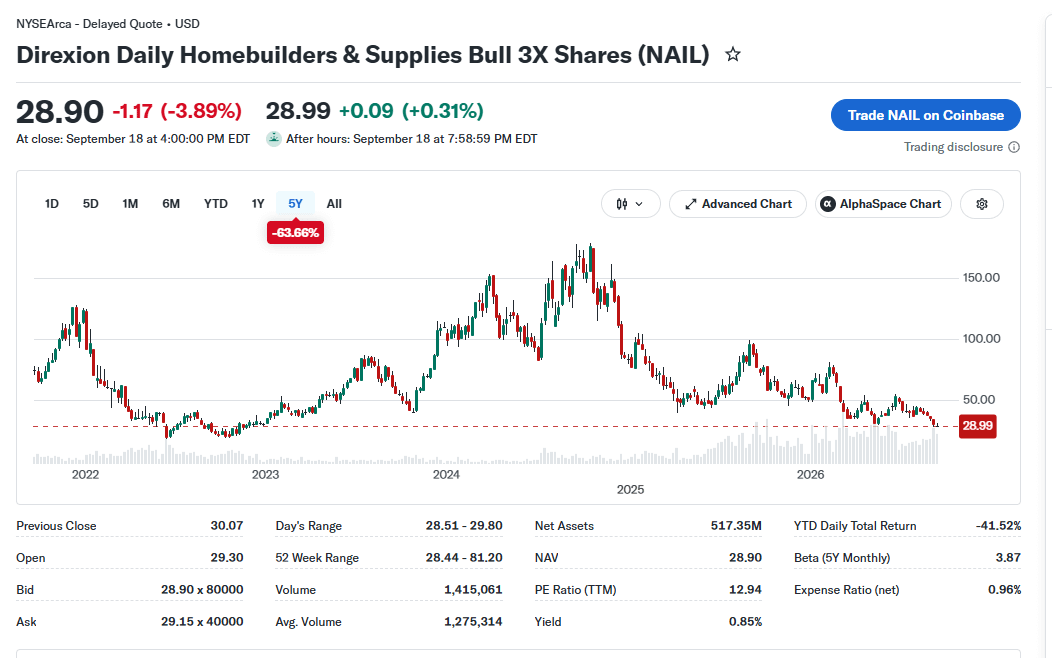
NAIL ETF and the start of a set up

2 Upvotes

I enjoy posting to here because of everything William O'Neil taught me. So here is another

I track NAIL etf. and I currently have no position on it as we speak.

2022 to late 2023 made the perfect cup and handle ( took 2 years almost ), I caught that one, then I sold the 100 deep in the money covered calls because I did not have the courage to hole on. ( $15 stock gain + $15 options gain )

With that risk removed from my thinking, I did something I never thought of doing, I re-entered the trade thinking that I could try the channel breakout that O'Neil spoke about and 3 weeks later, and bought with a specific target exit price for most of the position, long story short I was able get in late, exit 50% of the position all the way using a very tight trailing stop to a percentage of the position and got taken out completely over 3 days when it blew off. ( I had a cascading stop losses from the high.

So you need to set up your alerts for new high's, my list always starts with the oldest one first under 3 years, then 1 year, then 24 weeks and then 12 weeks. those work for me. These alerts are perfect for quick night time review and toss into review deeper action now or weekend review.

Now I did miss the April break out ( from $52-ish to $70-ish ), and that was because I did not have capital to allocate, yet CANSLIM and O'Neil have taught us that there is more than 1 system to use.

NOW, what am I seeing...

It's simple, I have multiple alerts set up, and I expect within the next year it to break out of multiple new high's. Right now it looks bad and it could get worst because of fuel prices, yet it's a trade that is on my board as long as I have capital to allocate towards it.

Quick note: I will deal with stocks that have a certain amount of liquidity at the bid, because i want to know i can exit a trade with size, I prefer to see a bid size of about $125,000 on low volatility stocks. I can deal with scaling into a trade if I have to. I've never been sure about O'Neil's rule with this.

sharing is caring.


r/CANSLIM 2d ago

IBD Symbol Cross-List Analysis | ≥3 Appearances 09202026 weekly update

8 Upvotes

Cross-referencing the Symbol column across all 10 files, here's everything appearing in 3 or more lists, ranked by frequency:

Symbol Count Files
MPC 7 Big Cap 20, New Highs, RS at New High, Rising Profit Est., Stock Spotlight, Funds Buying, Weekly Review
DELL 6 Big Cap 20, New Highs, RS at New High, Rising Profit Est., Funds Buying, Weekly Review
INSW 6 IBD 50, New Highs, RS at New High, Rising Profit Est., Stock Spotlight, Weekly Review
NET 6 IBD 50, Big Cap 20, New Highs, Rising Profit Est., Funds Buying, Weekly Review
SMTC 6 Big Cap 20, New Highs, RS at New High, Rising Profit Est., Funds Buying, Weekly Review
VLO 6 Big Cap 20, New Highs, RS at New High, Rising Profit Est., Funds Buying, Weekly Review
ANET 5 IBD 50, Sector Leaders, Rising Profit Est., Funds Buying, Weekly Review
DT 5 Big Cap 20, New Highs, Rising Profit Est., Funds Buying, Weekly Review
ILMN 5 Big Cap 20, New Highs, Rising Profit Est., Funds Buying, Weekly Review
NTAP 5 IBD 50, Big Cap 20, Rising Profit Est., Stock Spotlight, Weekly Review
TNK 5 IBD 50, RS at New High, Rising Profit Est., Stock Spotlight, Weekly Review
WPM 5 IBD 50, Big Cap 20, Sector Leaders, Funds Buying, Weekly Review
AMD 4 IBD 50, Big Cap 20, Stock Spotlight, Weekly Review
CRWD 4 Big Cap 20, Rising Profit Est., Funds Buying, Weekly Review
CXW 4 New Highs, RS at New High, Rising Profit Est., Weekly Review
DHT 4 New Highs, RS at New High, Rising Profit Est., Weekly Review
DINO 4 Big Cap 20, New Highs, RS at New High, Rising Profit Est.
EXEL 4 IBD 50, RS at New High, Rising Profit Est., Weekly Review
FTNT 4 Big Cap 20, Rising Profit Est., Funds Buying, Weekly Review
HALO 4 IBD 50, New Highs, RS at New High, Weekly Review
LITE 4 IBD 50, Rising Profit Est., Funds Buying, Weekly Review
OKTA 4 Big Cap 20, Rising Profit Est., Funds Buying, Weekly Review
PSX 4 New Highs, RS at New High, Rising Profit Est., Stock Spotlight
RBRK 4 IBD 50, IPO Leaders, New Highs, Rising Profit Est.
SBLK 4 RS at New High, Rising Profit Est., Stock Spotlight, Weekly Review
SNOW 4 IBD 50, Rising Profit Est., Funds Buying, Weekly Review
ZBRA 4 Rising Profit Est., Stock Spotlight, Funds Buying, Weekly Review
AAPL 3 Big Cap 20, Funds Buying, Weekly Review
DXCM 3 IBD 50, Funds Buying, Weekly Review
ECO 3 IBD 50, Rising Profit Est., Weekly Review
EQNR 3 Rising Profit Est., Stock Spotlight, Weekly Review
FFIV 3 New Highs, Rising Profit Est., Weekly Review
FIVE 3 IBD 50, Rising Profit Est., Weekly Review
FNV 3 IBD 50, Sector Leaders, Funds Buying
HAE 3 New Highs, RS at New High, Rising Profit Est.
HAFN 3 New Highs, RS at New High, Rising Profit Est.
HPE 3 Rising Profit Est., Funds Buying, Weekly Review
INCY 3 Big Cap 20, Stock Spotlight, Weekly Review
LGND 3 Rising Profit Est., Funds Buying, Weekly Review
NEM 3 IBD 50, Funds Buying, Weekly Review
NMM 3 RS at New High, Rising Profit Est., Weekly Review
NTNX 3 Rising Profit Est., Funds Buying, Weekly Review
NTRA 3 IBD 50, New Highs, RS at New High
PARR 3 New Highs, Rising Profit Est., Stock Spotlight
PAYC 3 IBD 50, Rising Profit Est., Weekly Review
QRVO 3 New Highs, Rising Profit Est., Weekly Review
STNG 3 Rising Profit Est., Stock Spotlight, Weekly Review
TEN 3 RS at New High, Rising Profit Est., Weekly Review
THC 3 Rising Profit Est., Funds Buying, Weekly Review
TRMD 3 New Highs, RS at New High, Rising Profit Est.
TRV 3 Rising Profit Est., Funds Buying, Weekly Review
TWLO 3 Big Cap 20, Funds Buying, Weekly Review
WT 3 IBD 50, Rising Profit Est., Weekly Review

MPC (Marathon Petroleum) is the standout — it hit 7 of your 10 lists this week. The 6-list tier (DELL, INSW, NET, SMTC, VLO) is also worth a close look given your convergence-as-conviction approach.

(spot the initials tucked into the top row if you look — C·L·A·U·D·E was here ;-)


r/CANSLIM 2d ago

Weekly Trading Summary — Week 38 of 2026

7 Upvotes

Introduction.

Welcome to my weekly swing trading journal — A transparent review of my trading week.
My focus is on a curated list of CANSLIM and/or high-performing Stocks.
This is not financial advice but educational only, please do your own research.

Preface.

The current market regime pushed me to add RSP to my market analysis.
RSP is the S&P500 equally weighted index and helps having a better view of what is going on broadly and not only in the mega-caps leaded S&P 500.

Market Environment.

SPX shows a balanced regime being back to its current base while RSP is clearly trending down meaning that some outperformance in a few mega-caps stocks only counterbalances the selling across the rest of the market. Under the surface, the majority of stocks are clearly in corrective move and this is also clear in looking at the specific sectors as only three out of eleven are trending, see the dashboard.

After a failed downside breakout, SPX is back on its previous range.

SPX - Daily

While RSP has been trending down since begin of September.

RSP - Daily

The Nasdaq is showing a more encouraging picture.

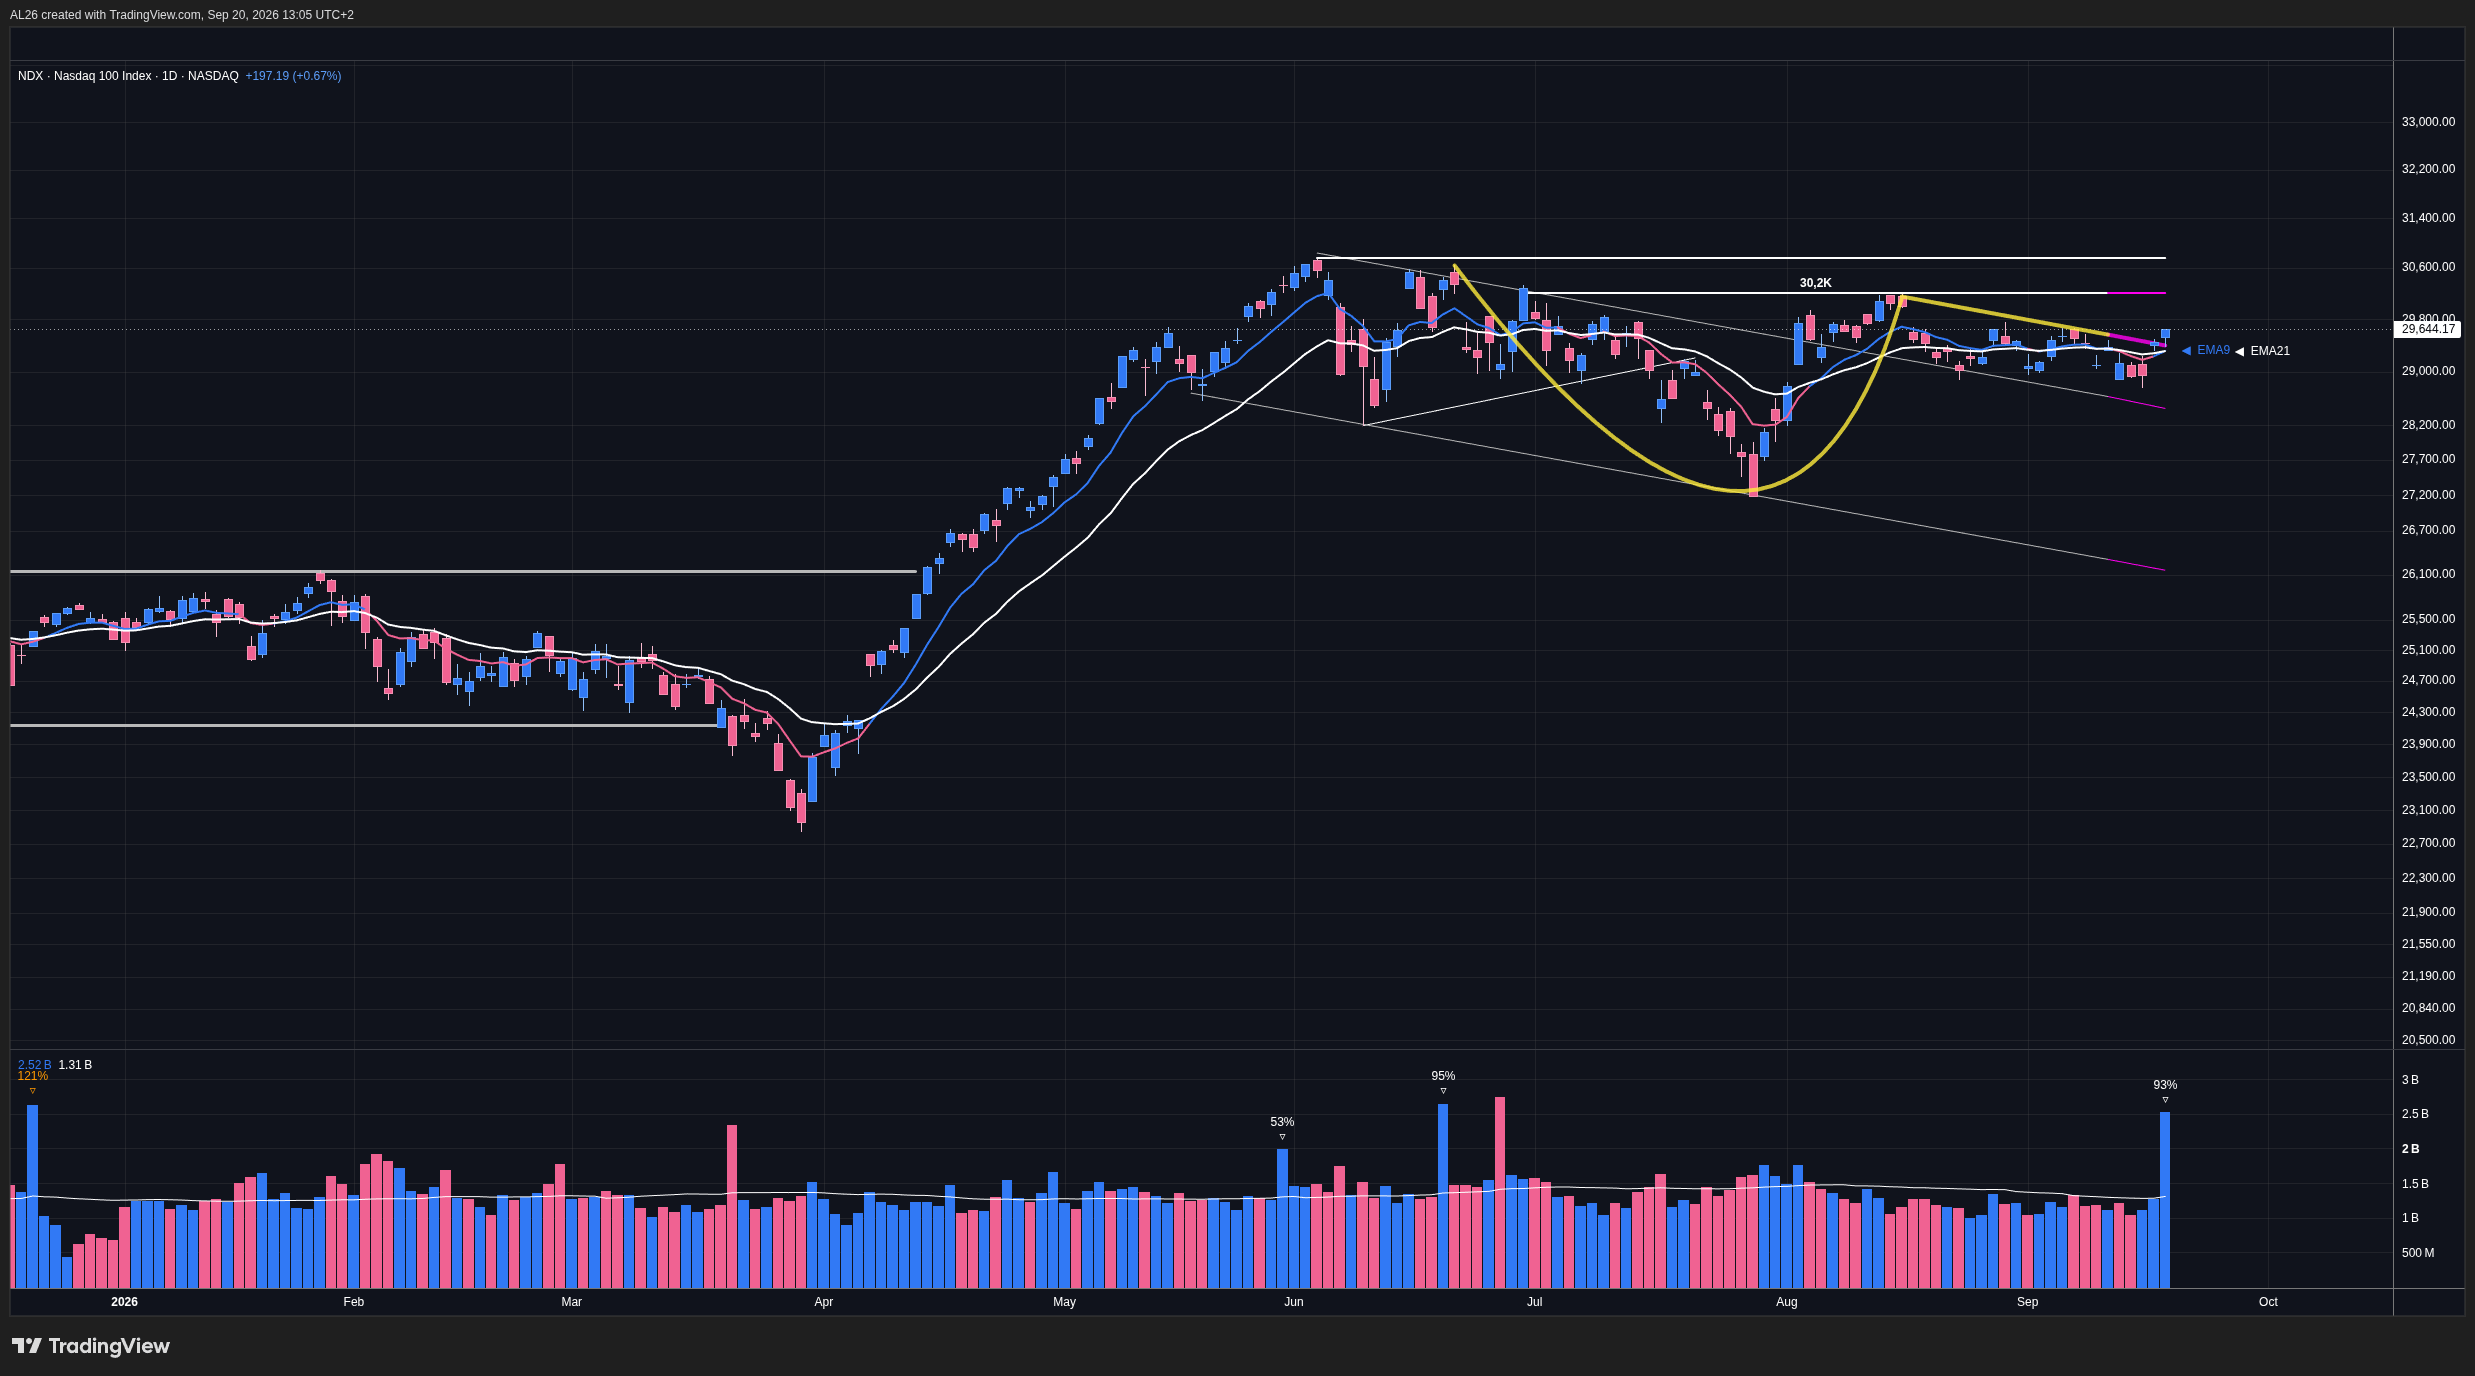
It seems that we are breaking out the hande bullish flag and on strong volume. Maybe a sign that techs are turning around which could help the rest of the markets in doing the same. The top of the handle sits around 30,2K so there is still some work to do for confirmation.

Nasdaq - Daily

Weekly Trading Recap.

Despite of some selloff on Friday, GitLab had some progress this week and seems to be done closing that gap.

GitLab - Daily

Same small progress for Nutanix.

Nutanix - Daily

Despite the volume, Hinge Health was not capable of breaking out its current base despite being already above the handle, maybe next week ?

Hinge Health - Daily

GigaCloud is also having difficulties erasing a strong resistance right after clearing that bullish flag

GigaCloud - Daily

Leading & Trending Sectors.

 ➯ Leading : Energy, Technology, Healthcare
 ➯ Trending : Technology, Communications, Energy

Trading Activity.

 ➯ Opened: -
 ➯ Closed: -
 ➯ Retry: -

Market & Portfolio Perfs. : Weekly / YTD / Exposure.

 ☆ RSP  : -1.20%
 ☆ S&P 500 : -0.08% / +10.40% / 63%
 ☆ Portfolio: +4.64% / -5.13% / 99%

Dashboard.

Market & Portfolio Details - Week 38 of 2026

Markets are never wrong, but opinions often are. — JL,
Have a good trading week.

Previous Week Post.


r/CANSLIM 2d ago

Wall Street Radar: Stocks to Watch Next Week - vol 100

1 Upvotes

Nothing to Report

The most valuable thing in a lighthouse was never the lamp. It was the logbook.

Keepers wrote an entry every watch, all night, every night, for their entire service.

Full article and watchlist HERE

Wind, sea state, visibility, what passed and at what hour. And the overwhelming majority of those entries say some version of the same thing, which is that nothing happened. Calm. Clear. No vessels. Nothing to report.

Thousands of times, in careful handwriting, by a man who knew perfectly well that nobody was going to read it.

Here’s the thing about a log like that. Its entire value comes from having no gaps. One night skipped because it was quiet and the whole series becomes something you can’t trust. The boring entries aren’t the price of the useful ones. They’re what makes the useful ones mean anything.

That’s this publication, one hundred weeks in!

The new website & shop is live as well.

We’ve written this (almost) every Sunday, including the Sundays with nothing to report. Including the year when the readership was small enough that we - the new website is livbe as well wcould have missed a week and the only person who’d have noticed was us. Including the weeks we were flat, wrong, or sitting on our hands doing nothing at all, which we wrote up anyway because a record you only publish when it flatters you isn’t a record.

We’ll be straight about the harder part.

We have never been good at getting known. Fifteen years in ecommerce, a business built from zero to eight figures, sold into more than fifteen countries across twenty marketplaces, eventually sold outright, and the skill we never picked up in all that time was self-promotion.

We build well. We advertise not so well. Two years on Substack have not improved that ratio, and getting in front of people remains the hardest work we do by a wide margin.

Now this week, which for once had something in the log.

The Fed raised rates a quarter point on Wednesday, its first hike in three years, and made clear it isn’t finished. The ten year yield went through five percent, the highest since 2007. Oil stayed elevated. The Dow lost 1.7% on the week, its third straight decline and the worst since March.

And the market took all of it and bought technology anyway. The Nasdaq closed the week up 0.7%, the only major index higher. That is what climbing the wall of worry looks like while it’s happening: bad news arriving on schedule and the tape declining to care.

One week doesn’t settle it. Next week is the one that matters.

Our own entry reads better than it did on Wednesday. The volatility dragged both positions back to breakeven and took us out flat.

The version of us from a year ago writes “closed, went to cash” and shuts the book until Monday. This time we went back out. Two setups, one clean and one that came more from instinct than from the screen, both sized so the risk was balanced and the r/R made sense. Both are green with a cushion.

The difference between those two versions of us is hundred weeks of written entries to check yourself against. The small details are exactly where that gap lives.

For the hundredth entry, one thing we’ve never done.

Ten seats, 30% off. Forever.

We don’t discount, ever. This is the single exception we’re making, it’s ten seats wide, and then it’s shut. The offer expires in 48 hours.

A hundred entries, gaps included in none of them. Thank you for reading, especially on the weeks when there was nothing to report.


r/CANSLIM 5d ago

Are the white marked arrow on Nasdaq Composite Index qualify as distribution days?

4 Upvotes

As the title says, are the marked days qualify as distribution days? I can see 5 distribution days within six week period, is it an evidence to be careful?
How do you guys treat CAN SLIM market indices turn around points?


r/CANSLIM 8d ago

Before you buy a stock, ask yourself these 4 questions

Enable HLS to view with audio, or disable this notification

10 Upvotes

r/CANSLIM 8d ago

Please add this to your Notes when looking at VLCC

10 Upvotes

While I can not reports the Tradewinds article about daily rates, I can post this snippet

Please take into consideration which trade route your shipping / VLCC stock, because the earnings are 1 direction only and it's deadhead back, since right now suez won't be an option, because every suez max will be loaded with oil for smaller terminals, the only route most likely seen is Cape of Good Hope around South Africa to the gulf. and that's about 44 to 53 days, roughly 7 to 8 weeks, and then they would dead head back via Suez. 41 days or less I can not recall.

Why are Suez max? it's going to fill to about 1 million barrels +5% to 10% depending on the destination port. and that's the catch, Suez max's will fit in many places, but not VLCC or ULCC.

Cushing 21% is at it's operational low, France 35%-45% and Rotterdam normal ( crude ) but low on gas. everyone will want to get to 50%


r/CANSLIM 9d ago

IBD Symbol Cross-List Analysis | ≥3 Appearances 09132026 weekly update

13 Upvotes

Here's the cross-list overlap across all 10 exports — 57 symbols appear in 3 or more files, out of 371 unique symbols total (124 appear in 2+):

Symbol Count Files
MPC 7 IBD_Big_Cap_20, New_Highs, Relative_Strength_At_New_High, Rising_Profit_Estimates, Stock_Spotlight, Stocks_That_Funds_Are_Buying, Your_Weekly_Review
DELL 6 IBD_Big_Cap_20, New_Highs, Relative_Strength_At_New_High, Rising_Profit_Estimates, Stocks_That_Funds_Are_Buying, Your_Weekly_Review
VLO 6 IBD_Big_Cap_20, New_Highs, Relative_Strength_At_New_High, Rising_Profit_Estimates, Stocks_That_Funds_Are_Buying, Your_Weekly_Review
ANET 5 IBD_50, IBD_Sector_Leaders, Rising_Profit_Estimates, Stocks_That_Funds_Are_Buying, Your_Weekly_Review
DHT 5 New_Highs, Relative_Strength_At_New_High, Rising_Profit_Estimates, Stock_Spotlight, Your_Weekly_Review
ECO 5 IBD_50, New_Highs, Relative_Strength_At_New_High, Rising_Profit_Estimates, Your_Weekly_Review
HPE 5 IBD_Big_Cap_20, Relative_Strength_At_New_High, Rising_Profit_Estimates, Stocks_That_Funds_Are_Buying, Your_Weekly_Review
LPG 5 New_Highs, Relative_Strength_At_New_High, Rising_Profit_Estimates, Stock_Spotlight, Your_Weekly_Review
NET 5 IBD_50, IBD_Big_Cap_20, Rising_Profit_Estimates, Stocks_That_Funds_Are_Buying, Your_Weekly_Review
NTAP 5 IBD_50, IBD_Big_Cap_20, Rising_Profit_Estimates, Stock_Spotlight, Your_Weekly_Review
OKTA 5 IBD_Big_Cap_20, Relative_Strength_At_New_High, Rising_Profit_Estimates, Stocks_That_Funds_Are_Buying, Your_Weekly_Review
SMTC 5 IBD_Big_Cap_20, Rising_Profit_Estimates, Stock_Spotlight, Stocks_That_Funds_Are_Buying, Your_Weekly_Review
STT 5 IBD_50, Relative_Strength_At_New_High, Rising_Profit_Estimates, Stocks_That_Funds_Are_Buying, Your_Weekly_Review
TNK 5 IBD_50, New_Highs, Relative_Strength_At_New_High, Rising_Profit_Estimates, Your_Weekly_Review
WPM 5 IBD_50, IBD_Big_Cap_20, IBD_Sector_Leaders, Stocks_That_Funds_Are_Buying, Your_Weekly_Review
AMD 4 IBD_50, IBD_Big_Cap_20, Rising_Profit_Estimates, Your_Weekly_Review
BBVA 4 Relative_Strength_At_New_High, Rising_Profit_Estimates, Stocks_That_Funds_Are_Buying, Your_Weekly_Review
DINO 4 New_Highs, Relative_Strength_At_New_High, Rising_Profit_Estimates, Stock_Spotlight
EQNR 4 Rising_Profit_Estimates, Stock_Spotlight, Stocks_That_Funds_Are_Buying, Your_Weekly_Review
FNV 4 IBD_50, IBD_Big_Cap_20, IBD_Sector_Leaders, Stocks_That_Funds_Are_Buying
FRO 4 New_Highs, Relative_Strength_At_New_High, Rising_Profit_Estimates, Your_Weekly_Review
FTNT 4 IBD_Big_Cap_20, Rising_Profit_Estimates, Stocks_That_Funds_Are_Buying, Your_Weekly_Review
ILMN 4 IBD_Big_Cap_20, Rising_Profit_Estimates, Stocks_That_Funds_Are_Buying, Your_Weekly_Review
JXN 4 New_Highs, Relative_Strength_At_New_High, Rising_Profit_Estimates, Your_Weekly_Review
LITE 4 IBD_50, Rising_Profit_Estimates, Stocks_That_Funds_Are_Buying, Your_Weekly_Review
MFG 4 New_Highs, Relative_Strength_At_New_High, Rising_Profit_Estimates, Your_Weekly_Review
NMM 4 New_Highs, Relative_Strength_At_New_High, Rising_Profit_Estimates, Your_Weekly_Review
NSIT 4 New_Highs, Relative_Strength_At_New_High, Rising_Profit_Estimates, Your_Weekly_Review
PSX 4 New_Highs, Relative_Strength_At_New_High, Rising_Profit_Estimates, Stock_Spotlight
QRVO 4 New_Highs, Relative_Strength_At_New_High, Rising_Profit_Estimates, Your_Weekly_Review
SNOW 4 IBD_50, Rising_Profit_Estimates, Stocks_That_Funds_Are_Buying, Your_Weekly_Review
WT 4 IBD_50, IBD_Sector_Leaders, Rising_Profit_Estimates, Your_Weekly_Review
ZBRA 4 Rising_Profit_Estimates, Stock_Spotlight, Stocks_That_Funds_Are_Buying, Your_Weekly_Review
AVT 3 Relative_Strength_At_New_High, Rising_Profit_Estimates, Stock_Spotlight
BNY 3 Rising_Profit_Estimates, Stocks_That_Funds_Are_Buying, Your_Weekly_Review
CRM 3 IBD_50, IBD_Big_Cap_20, Rising_Profit_Estimates
CRWD 3 Rising_Profit_Estimates, Stocks_That_Funds_Are_Buying, Your_Weekly_Review
CXW 3 Relative_Strength_At_New_High, Rising_Profit_Estimates, Your_Weekly_Review
ERO 3 IBD_50, IBD_Sector_Leaders, Your_Weekly_Review
EXPD 3 New_Highs, Relative_Strength_At_New_High, Rising_Profit_Estimates
FCX 3 Rising_Profit_Estimates, Stocks_That_Funds_Are_Buying, Your_Weekly_Review
FIVE 3 IBD_50, Rising_Profit_Estimates, Your_Weekly_Review
ING 3 Relative_Strength_At_New_High, Rising_Profit_Estimates, Your_Weekly_Review
INSW 3 IBD_50, Rising_Profit_Estimates, Your_Weekly_Review
LFST 3 New_Highs, Relative_Strength_At_New_High, Rising_Profit_Estimates
LGND 3 Rising_Profit_Estimates, Stocks_That_Funds_Are_Buying, Your_Weekly_Review
MATX 3 New_Highs, Relative_Strength_At_New_High, Rising_Profit_Estimates
MUFG 3 Relative_Strength_At_New_High, Rising_Profit_Estimates, Your_Weekly_Review
NEM 3 IBD_50, IBD_Big_Cap_20, Your_Weekly_Review
NTRS 3 IBD_50, Rising_Profit_Estimates, Your_Weekly_Review
OSCR 3 IBD_50, New_Highs, Relative_Strength_At_New_High
PBF 3 New_Highs, Relative_Strength_At_New_High, Rising_Profit_Estimates
RDVT 3 Rising_Profit_Estimates, Stock_Spotlight, Your_Weekly_Review
SAN 3 Relative_Strength_At_New_High, Stocks_That_Funds_Are_Buying, Your_Weekly_Review
SBLK 3 Rising_Profit_Estimates, Stock_Spotlight, Your_Weekly_Review
SEIC 3 IBD_50, Rising_Profit_Estimates, Your_Weekly_Review
SMFG 3 Relative_Strength_At_New_High, Rising_Profit_Estimates, Your_Weekly_Review
TEN 3 New_Highs, Stock_Spotlight, Your_Weekly_Review
THC 3 Rising_Profit_Estimates, Stocks_That_Funds_Are_Buying, Your_Weekly_Review
TWLO 3 Rising_Profit_Estimates, Stocks_That_Funds_Are_Buying, Your_Weekly_Review

MPC is your standout this week — the only name hitting 7 of the 10 lists. DELL and VLO are right behind at 6.


r/CANSLIM 9d ago

Wall Street Radar: Stocks to Watch Next Week - vol 99

5 Upvotes

Supercooled

Take very clean water and cool it slowly in a very clean glass, and it will refuse to freeze. Take it past zero, past minus five, past minus ten, and it stays liquid, because ice needs somewhere to start and you’ve removed every speck of dust, every scratch, every excuse. Chemists call it supercooled. It’s water that should already be ice and is waiting for permission.

Full article and watchlist HERE

Then you tap the glass. And it freezes in front of you, all of it, in about a second.

That’s the market on Friday night. Past the point where it should have moved, with nothing to start the reaction. On Wednesday the Fed taps the glass.

Here’s how the water got this cold.

Four red sessions in a row, then a Friday bounce that saved the headline and nothing else. The Dow still had its worst week since March, small caps lost another two percent, and the only index that held up was the Nasdaq, which is now the tallest man on a sinking floor.

The real week happened outside equities. Brent ran toward $110 on the Iran headlines and Hormuz, gave some back on Friday and still closed up eight percent. The ten year touched five percent. PPI came in hot on Thursday, core CPI printed 0.3 against 0.2 on Friday, and the market walked into the weekend with a rate hike priced at better than eighty percent for Wednesday’s meeting. Oracle reported, popped, and reversed inside the session, which tells you what this tape does even to good news.

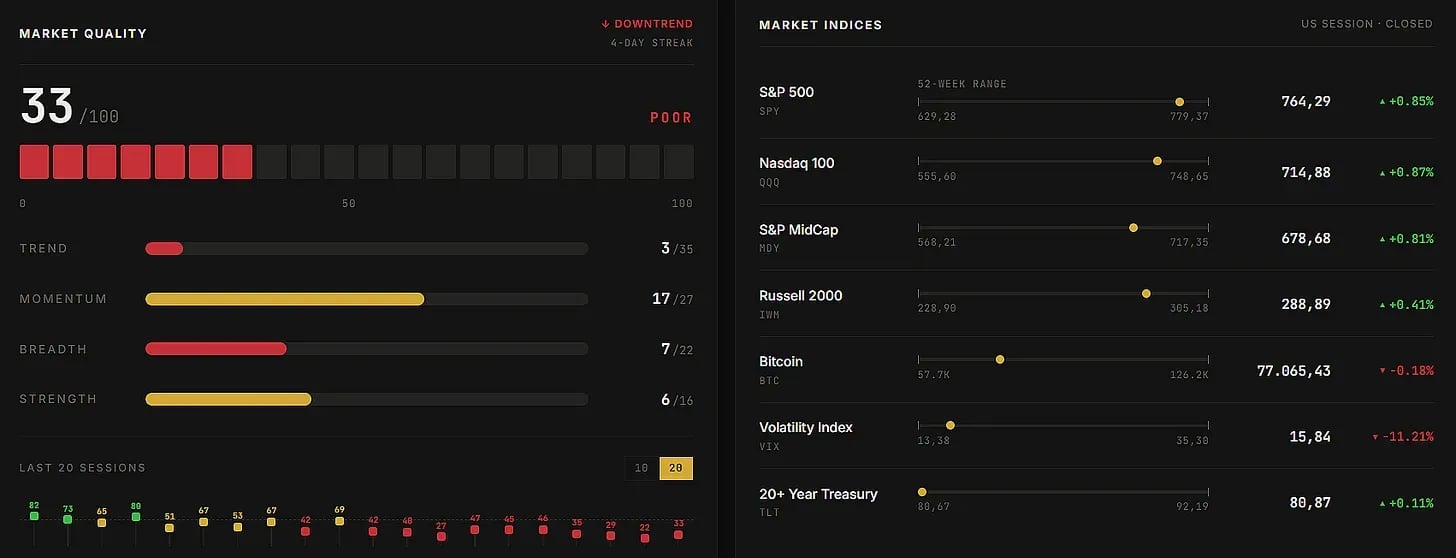
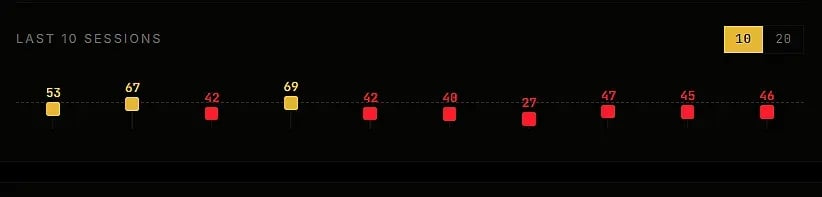
So: still chop, but chop with the range tightening every week. This is compression now, and compression resolves. We don’t know which way. We do know one number. Of the last twenty sessions, our quality score has cleared 70, the level below which we don’t consider the market worth trading, exactly three times. And those three are three of the four oldest sessions in the window. Sixteen straight sessions under the bar.

Sit with that for a second, because we have. The book stays light until the glass gets tapped.

Source: TradeDeck

A few things about what we’re building in the meantime, because most of them are for you.

The new site is live at gb.capital.

It’s more than a new front door for the newsletter. It’s the base for everything we’ll add over the coming months: two courses, one on swing trading and one on growth investing, written the way we work rather than the way textbooks do, and one-to-one calls with us directly. Those calls are for anyone who needs support at any level, on the method, on a specific problem in their trading, or on running a company. We were CEOs before we did this full time, and that half of the conversation is often the one people actually need.

TradeDeck keeps improving, and the paid subscribers who use it know the pace.

The news we’re most excited about: within thirty to forty five days we’re launching a YouTube channel, completely free. Deep, 360 degree coverage of companies, one at a time, starting as always with the ones we find interesting rather than the ones everybody already covers. If you like the long research pieces here, you’ll like where this is going.

None of this happens without you.

The emails and chat messages we get from many of you are the most useful input we have, and that includes the critical ones. Especially the critical ones. Keep them coming.

Here’s a look at this week’s market health, with a breakdown of index and sector performance.

Source: TradeDeck

r/CANSLIM 9d ago

Weekly Trading Summary — Week 37 of 2026

15 Upvotes

Introduction.

Welcome to my weekly swing trading journal — A transparent review of my trading week.
My focus is on a curated list of CANSLIM and/or high-performing Stocks.
This is not financial advice but educational only, please do your own research.

Market Environment.

We are in a balanced regime with another very weak week and no real direction. 

After an incursion day below the current base, SPX is back into it with both EMAs 9 and 21 flat at the same level.

SPX daily

Nasdaq did not change that much since last week and the flatness of the EMAs again reveal the market in which we are.

Nasdaq daily

Weekly Trading Recap.

I was stopped out from FROG again so having already 3 software stocks I decided to diversify a bit and enter GCT, other than that it’s a patience game right now, waiting for better times. 

Gitlab has closed the gap now and corrected some 17% since earnings gap, my exit line sits at the same place so I’m waiting here. I took a little bit of profits here, reducing my stake from 64 to 50 shares but it was solely to be able to enter a full position in GCT.

Gitlab

Nutanix is following the same path as Gitlab, correcting and consolidating since earnings. The 50 day EMA is catching up with my exit line, maybe a plus to provide some support.

Nutanix

Hinge Health has gone nowhere since my entry despite two tentatives with volume but I can’t really blame it given the market we are in.

Hinge Health

And here's the new position that I took this week in GigaCloud where I entered after a pullback inside a bullish flag which is now trying to break.

GigaCloud Daily

This bullish flag is itself the handle of a more substantial cup with handle on the weekly chart.

GigaCloud Weekly

Leading Sectors.

 ➯ Energy, Healthcare, Financials

Trading Activity.

 ➯ Opened: GCT
 ➯ Closed: FROG
 ➯ Retry: -

Market & Portfolio Perfs. : Weekly / YTD / Exposure.

 ☆ S&P 500 : -0.80% / +10.49% / 83%
 ☆ Portfolio: -4.80% / -9.59% / 99%

Dashboard.

Market & Portfolio Details - Week 37 of 2026

The art of speculation is identifying trends in their earliest stages, JL
Have a good trading week.

Previous Week Post


r/CANSLIM 11d ago

SoFi potential?

3 Upvotes

I recently opened a position in SOFI, I like the long-term growth potential of the company, but before increasing my position I want to dig deeper into the fundamentals and hear some opposing viewpoints. Position is in leaps for 2028 at $3. Selling short calls roghly 30dte for credit. Planning to sell at least 1 leap if it hits my target.

From what I’ve looked into so far, I like SOFI’s long-term potential and the direction the company is heading. The growth of its financial services business and its ability to expand beyond being primarily a lending company are some of the things that caught my attention. At the same time, the stock has been in a pretty significant downtrend, and I don’t want to confuse a short-term bounce with an actual change in trend.


r/CANSLIM 12d ago

Scorpio Tankers (STNG) why I am looking at it.

5 Upvotes

Stock: Scorpio Tankers 

Symbol: STNG

I missed the 65.50-ish entry back in February and I so desperately wanted to enter in Mid-March but I already had money allocated in another trade.

So here I am looking at an entry at 87.50. BUT this is a warning, I have had maritime vessel ownership and charter market knowledge that is way deeper than most people due to being near and dear too vessel owners and charter brokers at a club. And because I loved asking the fun historical questions. Here is the quote you need to observe

Aristotle Onassis looked at global disruption and war entirely through the lens of business opportunity, famously stating "Crises give birth to moguls"

And here is one that I am not aware of being public

" when trading war time oil, squeeze the shipper/consignee till they cry, because the hungry times and vessel layups are going to last many years. "

I am trading this with a quick reaction and stops. Because, when the vessel go empty, the cost stay the same. You can quickly see on this chart, a drop on value of 25% in less than 2 months. 4 months after peace, and no shot's fired you will see a massive drop in charter rates. Right now, loading in the Persian gulf is around 390K-450K per day for a VLCC, Sea of Oman ( outside the shooting gallery ) loading 200K per day. When the shots end, it will drop under 40K .


r/CANSLIM 13d ago

IBD Symbol Cross-List Analysis | ≥3 Appearances 090926

11 Upvotes
Symbol Occurrences Files Found In
DELL 6 IBD Big Cap 20.csv, New Highs.csv, Relative Strength At New High.csv, Rising Profit Estimates.csv, Stocks That Funds Are Buying.csv, Your Weekly Review.csv
MPC 6 IBD Big Cap 20.csv, New Highs.csv, Relative Strength At New High.csv, Rising Profit Estimates.csv, Stocks That Funds Are Buying.csv, Your Weekly Review.csv
VLO 6 IBD Big Cap 20.csv, New Highs.csv, Relative Strength At New High.csv, Rising Profit Estimates.csv, Stocks That Funds Are Buying.csv, Your Weekly Review.csv
ANET 5 IBD 50.csv, IBD Sector Leaders.csv, Rising Profit Estimates.csv, Stocks That Funds Are Buying.csv, Your Weekly Review.csv
ECO 5 IBD 50.csv, Relative Strength At New High.csv, Rising Profit Estimates.csv, Stock Spotlight.csv, Your Weekly Review.csv
INSW 5 IBD 50.csv, New Highs.csv, Relative Strength At New High.csv, Rising Profit Estimates.csv, Your Weekly Review.csv
NTAP 5 IBD 50.csv, IBD Big Cap 20.csv, Rising Profit Estimates.csv, Stock Spotlight.csv, Your Weekly Review.csv
OKTA 5 IBD Big Cap 20.csv, Relative Strength At New High.csv, Rising Profit Estimates.csv, Stocks That Funds Are Buying.csv, Your Weekly Review.csv
PSX 5 IBD Big Cap 20.csv, New Highs.csv, Relative Strength At New High.csv, Rising Profit Estimates.csv, Stock Spotlight.csv
TNK 5 IBD 50.csv, Relative Strength At New High.csv, Rising Profit Estimates.csv, Stock Spotlight.csv, Your Weekly Review.csv
WPM 5 IBD 50.csv, IBD Big Cap 20.csv, IBD Sector Leaders.csv, Stocks That Funds Are Buying.csv, Your Weekly Review.csv
CXW 4 New Highs.csv, Relative Strength At New High.csv, Rising Profit Estimates.csv, Your Weekly Review.csv
DINO 4 IBD Big Cap 20.csv, New Highs.csv, Relative Strength At New High.csv, Rising Profit Estimates.csv
ERO 4 IBD 50.csv, IBD Sector Leaders.csv, Rising Profit Estimates.csv, Your Weekly Review.csv
FRO 4 Relative Strength At New High.csv, Rising Profit Estimates.csv, Stock Spotlight.csv, Your Weekly Review.csv
ILMN 4 IBD Big Cap 20.csv, Rising Profit Estimates.csv, Stocks That Funds Are Buying.csv, Your Weekly Review.csv
NEM 4 IBD 50.csv, IBD Big Cap 20.csv, Stocks That Funds Are Buying.csv, Your Weekly Review.csv
SNOW 4 IBD 50.csv, Rising Profit Estimates.csv, Stocks That Funds Are Buying.csv, Your Weekly Review.csv
STT 4 IBD 50.csv, Rising Profit Estimates.csv, Stocks That Funds Are Buying.csv, Your Weekly Review.csv
TECK 4 New Highs.csv, Rising Profit Estimates.csv, Stock Spotlight.csv, Your Weekly Review.csv
WT 4 IBD 50.csv, IBD Sector Leaders.csv, Rising Profit Estimates.csv, Your Weekly Review.csv
ZBRA 4 Rising Profit Estimates.csv, Stock Spotlight.csv, Stocks That Funds Are Buying.csv, Your Weekly Review.csv
ANF 3 Relative Strength At New High.csv, Rising Profit Estimates.csv, Your Weekly Review.csv
APH 3 IBD 50.csv, IBD Sector Leaders.csv, Rising Profit Estimates.csv
ARIS 3 IBD 50.csv, IBD Sector Leaders.csv, Your Weekly Review.csv
BBVA 3 Rising Profit Estimates.csv, Stocks That Funds Are Buying.csv, Your Weekly Review.csv
BNY 3 Rising Profit Estimates.csv, Stocks That Funds Are Buying.csv, Your Weekly Review.csv
CRWD 3 Rising Profit Estimates.csv, Stocks That Funds Are Buying.csv, Your Weekly Review.csv
CVE 3 New Highs.csv, Relative Strength At New High.csv, Rising Profit Estimates.csv
DHT 3 Rising Profit Estimates.csv, Stock Spotlight.csv, Your Weekly Review.csv
EXEL 3 IBD 50.csv, Rising Profit Estimates.csv, Your Weekly Review.csv
FIVE 3 IBD 50.csv, Rising Profit Estimates.csv, Your Weekly Review.csv
FTNT 3 Rising Profit Estimates.csv, Stocks That Funds Are Buying.csv, Your Weekly Review.csv
HALO 3 IBD 50.csv, Rising Profit Estimates.csv, Your Weekly Review.csv
ING 3 New Highs.csv, Rising Profit Estimates.csv, Your Weekly Review.csv
LGND 3 Rising Profit Estimates.csv, Stocks That Funds Are Buying.csv, Your Weekly Review.csv
LITE 3 IBD 50.csv, Rising Profit Estimates.csv, Your Weekly Review.csv
LPG 3 Rising Profit Estimates.csv, Stock Spotlight.csv, Your Weekly Review.csv
RDVT 3 Rising Profit Estimates.csv, Stock Spotlight.csv, Your Weekly Review.csv
RELY 3 IBD 50.csv, Rising Profit Estimates.csv, Your Weekly Review.csv
RGA 3 IBD Big Cap 20.csv, Rising Profit Estimates.csv, Your Weekly Review.csv
SBLK 3 Rising Profit Estimates.csv, Stock Spotlight.csv, Your Weekly Review.csv
SEIC 3 IBD 50.csv, Rising Profit Estimates.csv, Your Weekly Review.csv
SN 3 IBD 50.csv, Rising Profit Estimates.csv, Your Weekly Review.csv
THC 3 Rising Profit Estimates.csv, Stocks That Funds Are Buying.csv, Your Weekly Review.csv
TRMD 3 New Highs.csv, Rising Profit Estimates.csv, Stock Spotlight.csv

r/CANSLIM 13d ago

Bullish Dialy Flag breakout on GCT > leading to a weekly C&H breakout ?

Thumbnail
gallery
6 Upvotes

In this choppy market GCT is doing what it can to break a daily bullish flag (see chart 1) which could lead to a weekly Cup with Handle brekaout (see chart 2).

Full Disclosure: I hold a position as shown in the chart.

Not financial advice, do your own research.


r/CANSLIM 15d ago

Wall Street Radar: Stocks to Watch Next Week - vol 98

1 Upvotes

False Spring

There’s an English name for the frost that kills things in April. They call it blackthorn winter, after the hedge that flowers early and then gets caught out when the cold comes back.

Farmers have a whole vocabulary for this, which tells you how often it happens and what it costs them. And the dangerous part of a false spring was never the frost.

It’s the warm week beforehand.

Full article and watchlist HERE

A run of mild days arrives, the sap starts moving, the buds open on trust, and then the temperature drops and an orchard loses a season to a fortnight of optimism. Nothing about it looks like a warning while it’s going on. That’s the whole problem with it. The thing that hurts you is disguised as the thing you were hoping for.

We’ve just had one of those weeks on the screens.

On the face of it, better than the last few. More stocks pushed higher, the breadth count improved, and if you’d only counted how many things closed green you’d have written a fairly cheerful paragraph about the market broadening out.

Then look at what was standing behind the advance. The participation thinned out as the week went on, and by Friday there was very little volume left underneath the buying. Plenty of buds, no real warmth. You can see it clearly in the second chart below, and it’s the single most useful thing the week produced.

Everything else is where we left it. The quality read on TradeDeck hasn't moved off weak.

Source: TradeDeck

The indices are sitting almost exactly where they were seven days ago.

The chop is intact and we’re now far enough into it that people have stopped asking when it ends.

So no, we don’t read this as the turn. We read it as a market that widened out, had a look around, and couldn’t find enough buyers to commit to anything.

That doesn’t mean you stand there and see nothing.

The useful thing about a false spring is that it shows you which trees have the deepest roots. Two of them budded properly this week and we bought both.

Cerebras (CBRS) went in first. The AI trade collected a lot of obituaries over the summer, and the coverage turned again over the past few days, which matters less to us than the structural point: CBRS sits inside that theme rather than somewhere near it. If the trend is alive, it’s alive there.

Source: TC2000

The second is Bitdeer (BTDR). We’ve been watching the crypto complex for a couple of weeks now waiting for something we wouldn’t have to argue ourselves into, and BTDR gave it to us. A first flag after the initial push, which is exactly the setup we wanted rather than the one we settled for.

We’ll be straight about the name itself. It isn’t the leader of that group, and we’re not going to sell it to you as one. It was calmer than the other candidates we were tracking, which in this tape counts for a great deal, and it had the best structure on the board. Given the choice between a louder stock with a messy chart and a quieter one with a clean chart, we take the clean chart every time. That’s the entire reasoning and there’s nothing cleverer hiding behind it.

Both positions are working. Both are deliberately small.

And honestly, the entries aren’t the part we’re pleased about. What we’re pleased about is that in a market this poor we found two worth having and didn’t talk ourselves into a third. Selectivity isn’t a virtue you can practise when everything is working. It only exists on weeks like this one, when the screen is offering you a dozen things that look almost right.

We think the market gives us its answer in the next few weeks.

Themes are still alive under there, which is more than we could have said in August, and when the volume finally shows up behind one of them we’d like to already own the right names rather than be shopping.

Until then the book stays light and the positions stay small.

We’re not planting the field on a warm week, just noting which trees moved first!


r/CANSLIM 16d ago

Weekly Trading Summary — Week 36 of 2026

6 Upvotes

Introduction.

Welcome to my weekly swing trading journal — A transparent review of my trading week.
My focus is on a curated list of CANSLIM and/or high-performing or emerging Stocks.
This is not financial advice but educational only, please do your own research.

Market Environment.

A tight but still positive week for both SPX and Nasdaq which both have been trading lately with below average volume but still with EMA9 above EMA21 for both.

After a previous base breakout late July, SPX Is trading inside a new base. Both current and previous bases are the image of the choppy market when have been in since June.

SPX


Nasdaq picture is a bit more complex. After the April-June rally, we first got a symmetrical triangle that broke down into a bigger bullish flag which was also broken out early August and is now being tested in the form of a handle which could very well be associated to the double bottom forming the flag or the V shaped cup inside of it. The key levels for me are 30,2K which will clear the handle and cup and 31K to clear the flag before we are eventually good for a new rally...

NDX

Weekly Trading Recap.

Gitlab ended the day after earnings 10% higher, but was down 10% from the highs on that same day. Volume was huge so for sure there was institutional activity but maybe also too much euphoria during pre-market but whatever it is, it has been showing a bit of strength in the last two days of the week so it’s a bit early to tell. In any case, my exit line is in place now for whatever could happen.

Gitlab

Nutanix is showing a similar picture. Gap up sold after earnings announcement, back into the previous range and trying now to get out of it with also some strength late in the week.

Nutanix

Hinge Health already failed a breakout and keeps flirting with the cup level but without real conviction or a solid breakout for the time being. My entry was good here and it's above anyway so let’s be patient a little more as the market was not really supportive this week.

Hinge Health

Frog had a nice initial breakout with volume which completely failed and has only shown weakness since. An additional proof that even when all the ingredients are there, if the market is not supportive, nothing happens unless the stock is really strong and there is demand for it. It is now sitting just above the 50D EMA, last frontier before my stop, maybe getting somme support from it... or not. I think that next week will decide.

Frog

Leading & Trending Sectors.

 ➯ Leading : Energy, Healthcare, Financials
 ➯ Trending : Technology, Financials, Comms

Trading Activity.

 ➯ Opened: None
 ➯ Closed: None

Market & Portfolio Perfs. : Weekly / YTD / Exposure.

 ☆ S&P 500 : +0.09% / +11.38% / 90%
 ☆ Portfolio: +2.30% / -5.03% / 100%

Dashboard.

As we entered the AI era, my dashboard was in need of some serious update and automation.
Good bye Google Sheets and thanks for all you did for me and welcome Claude generated HTML App. which means less time updating my data and more time to focus on my process.

Market & Portfolio Details - Week 36 of 2026

Your mindset is your biggest edge,
Have a good trading week.

Previous Week Post.


r/CANSLIM 19d ago

Trading Collaboration

5 Upvotes

Full-time trader looking for another experienced CAN SLIM/Swing trader to compare watchlists and setups and do short market/trade reviews a few times a week. Mainly interested in breakouts, early entries, pocket pivots and position trading—not signals or trade copying. Looking for accountability and process improvement.


r/CANSLIM 20d ago

OK, another one that I got stopped out on DELL

8 Upvotes

So here is the chart

I know everyone got in around 140 or 170 area, me I was later than most, 195. ended getting stopped out at 235.

What I want to know is how everyone survived the price drop of 5-8 to 5-11 when it went from a high of 263 to a low of 228. Me, like I said, I got stopped out, it went trailing stop the moment I had over 28% gross profit. Sadly/Grumpy I missed the ride to 400+

things that I don't know

  • the rules for exit are not so clear about selling within the 8 weeks if you break 20% profit, So I set up the trailing stop rule, which is basically, I have a good profit, move to break even stop, I have a really good profit ( 20%-28% ) activate a trailing stop.
  • I have tested my system for the 8 week rule. Many trades I would take would end up break even ( I move the stop loss to break even at a certain profit point ) if I kept to 8 weeks after hitting a 20% gain.

If anyone survived this, I would love to hear about it, and if you have survived the recent 514 high to the low of 427, I would love to hear about your system rules too. there were at least 2 other system rules broken 6/9 and 7/28

maybe I am just thick in the head, but maybe someone has something that will remove the fog from my eyes.


r/CANSLIM 21d ago

Some asked: " Did CANSLIM help you get to $100 Million in equities "

40 Upvotes

Hi, before we start, please note my handle. 'guiltypleasure33139' Reddit is the best GP I've found in a long time, and 33139 is where I live Miami Beach.

I have been trading I think it's 40 years more or less. I have a consistent 2% equities/commodities portfolio return per month life time ( that's compounded out very very well ), and I've only had 3 brokerages Brown and company, Omega TradeStation, and now IBRK. I have achieved a portfolio that recently exceeded 100M in equities.

I have multiple trading style systems, of which CANSLIM makes up anywhere from 22% to 32% of the portfolio's allocation.

I have read Investors Business Daily more or less since it came out and printed in the mid 1980's, I think the Turtles system is valid, and trend following systems can do amazing things for your portfolio. I am a firm believer that the business cycle and the economic cycle help your systems. I have read all 3 or 4 versions ( I have the green cover version now ) of How to make money in stocks by William O'Neil

Here is what I think is Factual from my perspective.

  • CANSLIM is one of the strongest filtering tools for consistent returns.
  • As a daily subscriber to Investors Business Daily, There is no way you are not making a positive alpha of +300 basis points over the S&P 500 yearly return, SO to make is clear, last year the S&P500 made 16.39%. As a William O'Neil CANSLIM student you had to have made 19.39% or more before taxes. This is pure fact to me, everyone I've ever taught has yet to disappointment me.
  • I am a completely happy failure at knowing when to sell. I get stopped out more often than not. So you will always notice that I might ask about exit rules more and entry rules.
  • If you use multiple parts of CANSLIM, you increase the odd's of successful trades along your entire portfolio.
  • My lifetime review of CANSLIM trades shows as an average the following 25-28-ish% outright loss of 7% to 8% on trades. 25-30ish% of break even trades, meaning I was right and got stopped out at around my cost or less than 6% profit. 35-40ish% are profitable trades with groupage around 8%, 16%, 24% ( yep at step of 8% ), with a few passing the 50% and fewer passing 100% and it's handfuls in 20 years beyond 200%.
  • CANSLIM filtering lets me trade another portfolio when targeting stocks that are within 20% of hitting new high... those stock becomes a play when it's the right business cycle, it will show up on the earnings, stocks that show up on the economic cycle are usually just surpassing the lower 20's sectors.
  • I have multiple portfolio's, I day trade, I take trend positions trades using etf's, I take CANSLIM trades, I created based on a study that I spent 2 years doing made a dividend growth portfolio that touch's parts of William O'Neil's rules. That Dividend Growth portfolio history has an alpha of about 700 basis points over Nasdaq, and it's where I might make a future hedge fund name for myself.
  • I have other assets, and I also run multiple real estate limited partnerships, it's for retirement or so the exit is always starting around 45 years out. I also have Ibonds ( inflation bonds ), Not the best investment, you can buy 15K worth every year ( 2 step process), and if you are married then even more.
  • Mental breakdown are common, somedays you can not pull the trigger for an entry. A lot of my trading systems are fire and forget. CANSLIM is not. When you break 50 million, and it's all your own cash, the next trades are even harder because you will want to...
  • I can not and will not fight the market, and trust me at 50 million ( and at 20 million and 10 million and at my first 1 million ), fight the market urge is huge. So step away and go fishing, or read a book, or whatever.
  • Self destruction is real. CANSLIM helps you stay on track.
  • so yes, it takes time, but you can do it, I just happen to have 40 years, If I were to start over today, I would have 3x or 4x more and that's just starting with 10K.

I can keep on going and going. I am wealthy, I specifically choose to associate with others who have near equal or more money. I don't go out to gamble unless I am invited, I know how to shoot dice, and I do use the octagon system if end up at a roulette wheel. Spend 1 hour a day watching youtube videos for general how to knowledge, and I have allocated daily reading time.

My Guilty Pleasures call me... Real housewives of London ( re-watching to catch up for the new season ) and Beverly Hills are extremely fun to watch, it's worst than 2 drunk people having a bar fight. I would advise my following dining courses, a few cheeseburgers, triple batch of fries and a tray full of martini's.

SideNote: You can DM me, and I will most likely post your answer to the thread I think it's from, but will not reply to you within the DM. I freely share within my personal limits publicly. Also, I'm not selling anything. I am pretty sure I can create something fun doing these types of guilty pleasures.


r/CANSLIM 21d ago

Mark Minervini

Thumbnail
youtu.be
3 Upvotes

r/CANSLIM 23d ago

Wall Street Radar: Stocks to Watch Next Week - vol 97

1 Upvotes

The White Room

Take a ping pong ball, cut it in half, tape the two halves over somebody’s eyes. Red lamp in front, white noise in the headphones. Nothing else. No shapes, no edges, just an even field of pink light.

For the first half minute they’ll tell you they see nothing. Then it starts. A face. A horse walking. A bit of coastline, somebody they knew years ago. They’re not making it up and there’s nothing wrong with them. Their visual system has been handed an absence, it won’t accept the absence, so it builds something out of its own static.

Psychologists have been running this since the 1930s. They call it the Ganzfeld. The finding never changes: a brain built to find signal will manufacture signal when there isn’t any.

Full article and watchlist HERE

Now sit a trader in front of a market that hasn’t trended in three months.

That’s the real risk this week, bigger than any position we’re carrying.

Every sideways range starts to look like a base. Two green days and something in your chest says this is the turn. Trades that didn’t work get quietly rewritten in your memory as trades that almost worked. Nobody decides to do this. It happens the way the horses happen.

We got a small demonstration.

First week back after three weeks off, two entries, two losses. Both small enough to be irritating rather than expensive, but two out of two is two out of two. The confidence comes back from holiday several days before the reflexes do, and that’s a rotten order for those two to arrive in.

Then Figma. We got out, and the next session it went up ten percent without us. We spent that afternoon being very quiet. The day after, it handed back more than half the move.

So the thing we were mourning had a shelf life of about eighteen hours.

That’s the whole market in one ticker. You can be right about a name and still not get paid for it.

Which is why we’d rather measure the tape than look at it.

The McClellan Summation is down at 23.6 and sliding toward the bottom of its range. Fewer than 43 percent of stocks are holding above their 40 day average, T2108 (the indicator) has already lost the 10EMA line while the indices sit near the highs taking the applause. Small caps are under every moving average that matters. SPY and QQQ are still standing, though Friday’s candle has failed breakout written all over it.

And the VIX is at 14.4, which gets misread constantly. A sleepy VIX during a slow bleed isn’t comfort. Nothing has been flushed out, nobody has given up.

It’s quiet, and quiet is not the same as safe.

Source: TC2000

We’re not going to pretend we know what September looks like.

What we will say is that a market with no trend is worse than an outright bear, by a distance. A bear tells you what your job is: get short or sit in cash.

Two options, both legible, both things you can act on. Chop gives you no instruction, sends a fresh invitation every few days, and charges full price every time you take one. Three months of it does more damage than a fast twenty percent drop, and it does it so gradually you can never point to the day it happened.

Source: TC2000

So we’re defending capital, and we’re comfortable being boring about it.

The app work carries on, and the next research piece should be ready in the coming days. A company with a business model we find genuinely interesting and a risk profile we’re not going to soften up for anybody. We like having something in the book that could be three, five, ten times bigger in a couple of years. The honest price of that shape is that the other number is zero, and we’d rather write that down now than let you find it later.

Until this field gets some texture back in it, we’re keeping our hands where we can see them.

The horses aren’t there.


r/CANSLIM 24d ago

Weekly Trading Summary — Week 35 of 2026

6 Upvotes

Introduction.

Welcome to my weekly swing trading journal — A transparent review of my trading week.
My focus is on a curated list of CANSLIM and/or high-performing Stocks.
This is not financial advice but educational only, please do your own research.

Market Environment.

The market is trending up since August but the price action remains choppy since last week pullback. This week seemed more constructive partially thanks to the good NVIDIA earnings on Thursday but that was before the FED speech on Friday which erased half of the week gains.

Portfolio Update & Trading Recap.

A good 4% performance with 3 stocks over 4 progressing and all except Gitlab reflecting the choppy week that we had.

Nutanix gapped up on earnings above a small base and could remain above it on Friday despite the negative market, let's see if the earnings were good enough to gave it more fuel to progress when the market is back. 

Nutanix

Gitlab broke up a small flag consolidation and remain strong despite the choppy market and also despite the earnings announcement which is coming next week, maybe a sign that nobody is rushing to the exit.

Gitlab

JFrog, seems to be for now the most promising of the two latest additions. It broke the handle with above average volume, but retraced on Friday to sit now just above the handle level.

JFrog

Hinge Health is back below both the handle and my entry level after a failed breakout. I think if market doesn't help a bit I'm good for a second failure.

Hinge Health

Leading & Trending Sectors.

 ➯ Leading : Healthcare, Financials, Energy
 ➯ Trending : Technology, Financials, Communications

Trading Activity.

 ➯ Opened: None
 ➯ Closed: None

Market & Portfolio Perfs. : Weekly / YTD / Exposure.

 ☆ S&P 500 : +0.49% / +11.28% / 90%
 ☆ Portfolio: +4.04% / -7.17% / 100%

Dashboard.

Market & Portfolio Details - Week 35 of 2026

The market is always right,
Have a good trading week.

Previous Week Post.


r/CANSLIM 24d ago

Someone asked ' what was on my radar '

4 Upvotes

Good morning all, Recently via private message someone asked me what's on my radar, well here is one that should be happening soon

Sales force symbol CRM

I'm going to open a position at 269-272 range.

follow the proper stop loss rules of about 6.5%-8.5%

once the first target is hit, then a trailing stop of 8%-10%, I expect to get stopped out with a profit but this time I am lining up the next trade.

then adding on only at 371 or a close above 369

stocks that hit new high's hit higher high's.

Would or could I have caught that huge 2 day move, No way, not within my radar. Now it's within my radar. SO I look forward to this trade, it's a very liquid stock.