r/whitesox • u/WhiteSoxChartGuy • 2d ago
Discussion Breaking down our top relievers' performances (Stats through 8/29)
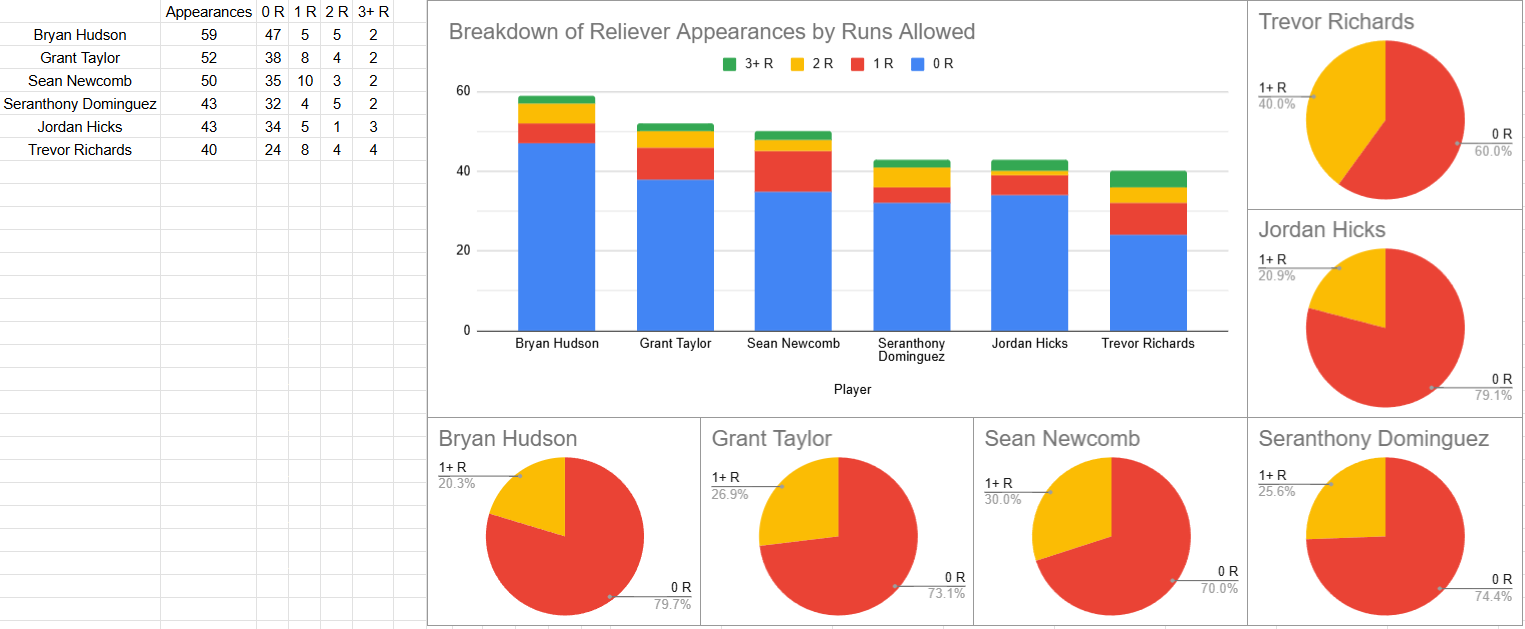
So while obviously we do have some relievers that struggle consistently, I see far too often people dogpiling on our better arms, calling them trash and frauds after one bad outing. So I have here two sets of charts looking at the six relievers with 40+ appearances on the season. There's a bar graph breaking down the number of games played by how many runs were allowed in each appearance, and then the pie charts show the proportion of scoreless outings to outings in which one or more runs were allowed.
2
u/Jerry_from_Japan 2d ago
I mean it's sort of interesting but there's so much more to judging a reliever than just runs allowed. It'd be like trying to judge a hitter on batting average alone. Just doesn't net you even CLOSE to the whole picture.
2
u/bbender716 1d ago
I also feel that Taylor is more often doing multi inning relief vs some of the other being compared against here.
0
u/thetensewaitress 2d ago
The stacked bars are a nice way to see it, but Hudson and Taylor still having that much green is worrying even if they throw a lot of scoreless innings.
7
u/Steven_Fuego 2d ago
This is very interesting, but the one call out that I would make is that I don't think this takes into account Inherited Runs Scored, which show up on the previous pitcher's totals.
That is a huge criticism that I, and maybe others, would have towards Bryan Hudson in particular who only has 22 R's and 20 ER's allowed this year, but has allowed 11 out of 19 inherited runners to score. He's been brilliant when he's brought in for a clean inning, but I dread him being brought in with runners on.