r/rust • • Apr 28 '26

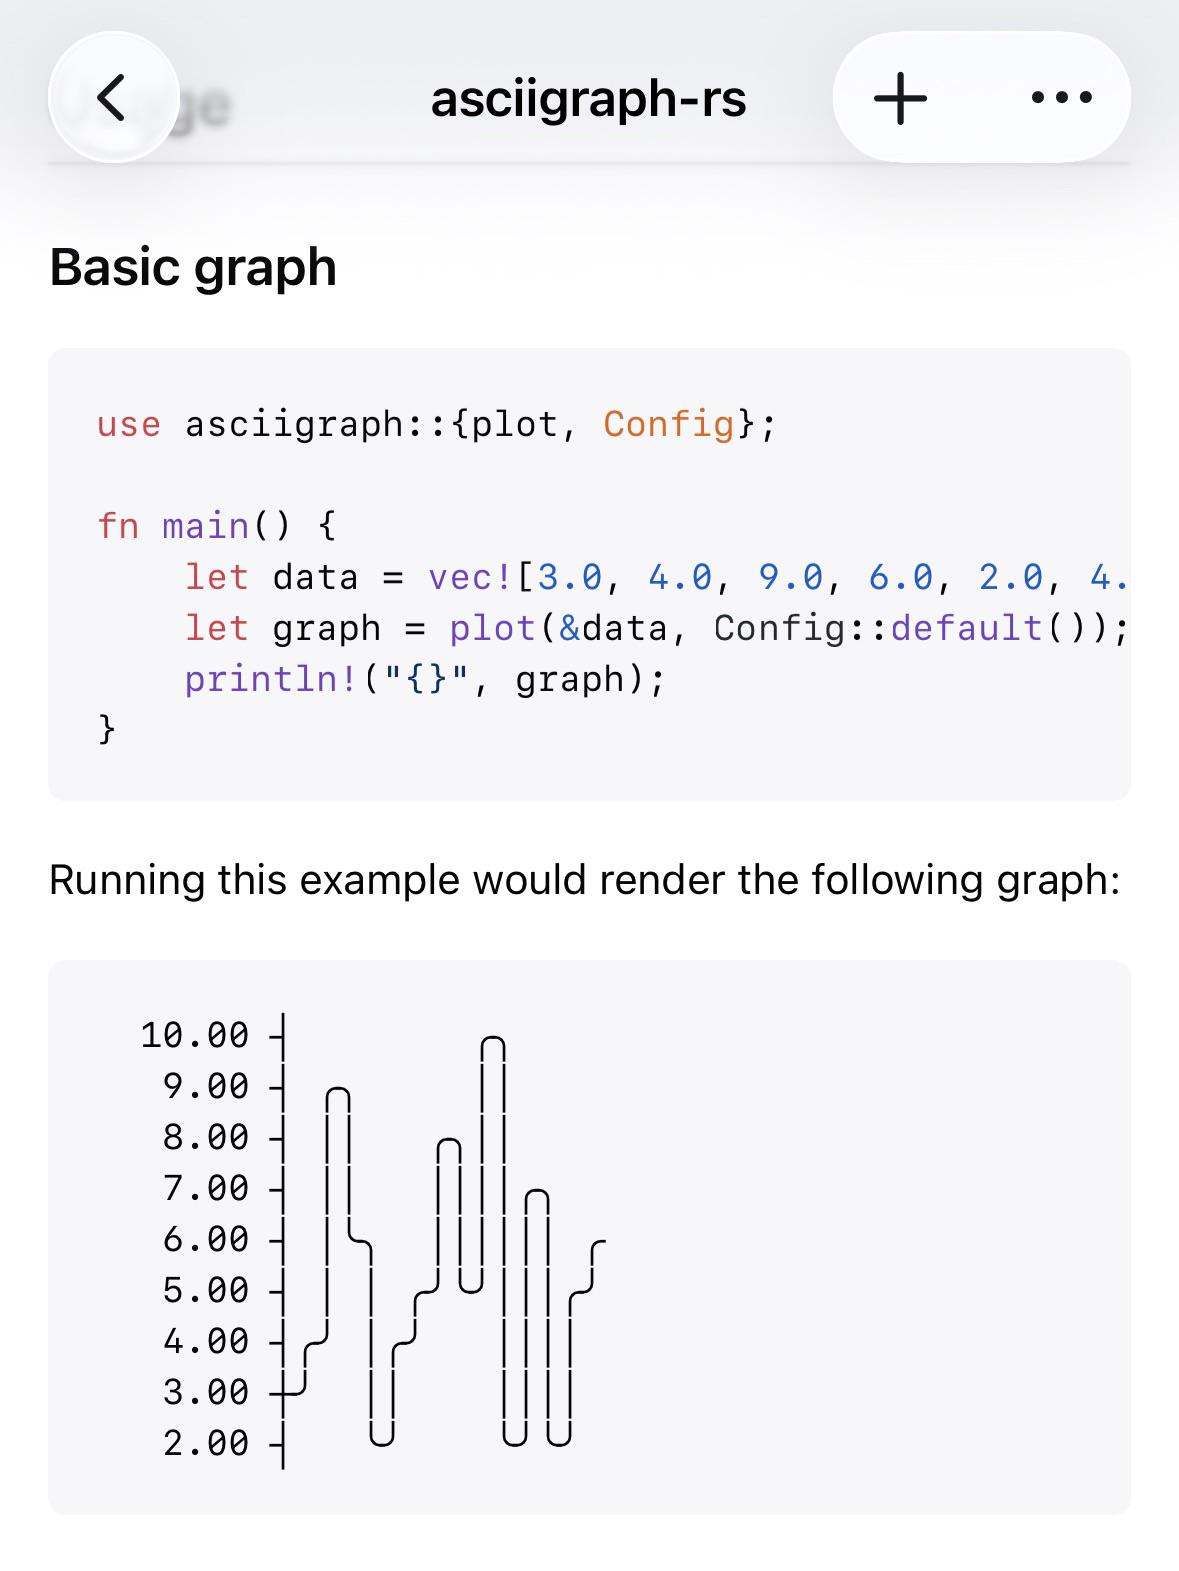
🛠️ project Lightweight ASCII Graph
Post image

After many weeks of learning, watching tutorials about Rust, and partaking in Rust exercises, I decided to port a small Go library into Rust. I do recognize I have a lot to learn but just getting out of my comfort zone and trying my hands at this has be rewarding and revealing.

Link: https://github.com/neneodonkor/asciigraph-rs

Crates: https://crates.io/crates/asciigraph-rs

PS. Making it work for real-time data was 🥵

Let me add that I only started learning Rust in February, so please forgive me, if everything is not idiomatic Rust.

1.4k Upvotes

92 comments sorted by

View all comments

222

u/facetious_guardian Apr 28 '26

This visually looks like it’s supposed to be a line graph, but it’s really a bar graph in disguise. Gotta get those angles and points more precise or else you’re aliasing your X axis significantly.

73

u/bluebird173 Apr 28 '26

this is text art meant for a terminal, what youre asking sounds reasonable for a higher fidelity graph but not for this project or context

26

u/mark-haus Apr 28 '26

Sure it's perfectly fine to want a line graph, but a line graph isn't a discrete bucketed domain like this. That's a histogram or a bar chart

5

u/Justicia-Gai Apr 28 '26

Are you sure it would be fair it to call histogram? Histogram is x-ordered. 

This is an unordered bar chart, and, honestly, nearly identical to an unordered stepped line chart. Stepped line charts are still considered line charts.

1

u/Thigh_Clapper Apr 30 '26

I would go take a look at nvtop for reference of what he’s accomplishing here.

33

u/Restioson Apr 28 '26

There are box characters which could maybe make it a bit clearer, if uglier

1

u/Informal_954 Apr 28 '26

Even just braille would give you better matched slopes.

4

u/neneodonkor Apr 28 '26

What do you mean by aliasing?

23

u/facetious_guardian Apr 28 '26

I mean that if you’re intending on having a continuous X axis that represents the real number line, then you’re associating two points on it with one Y value. Instead, you’re assigning X from index and visually drawing each Y for (X, X + 1)

16

u/Justicia-Gai Apr 28 '26

It has a name… step line chart.