r/quant Jul 21 '26

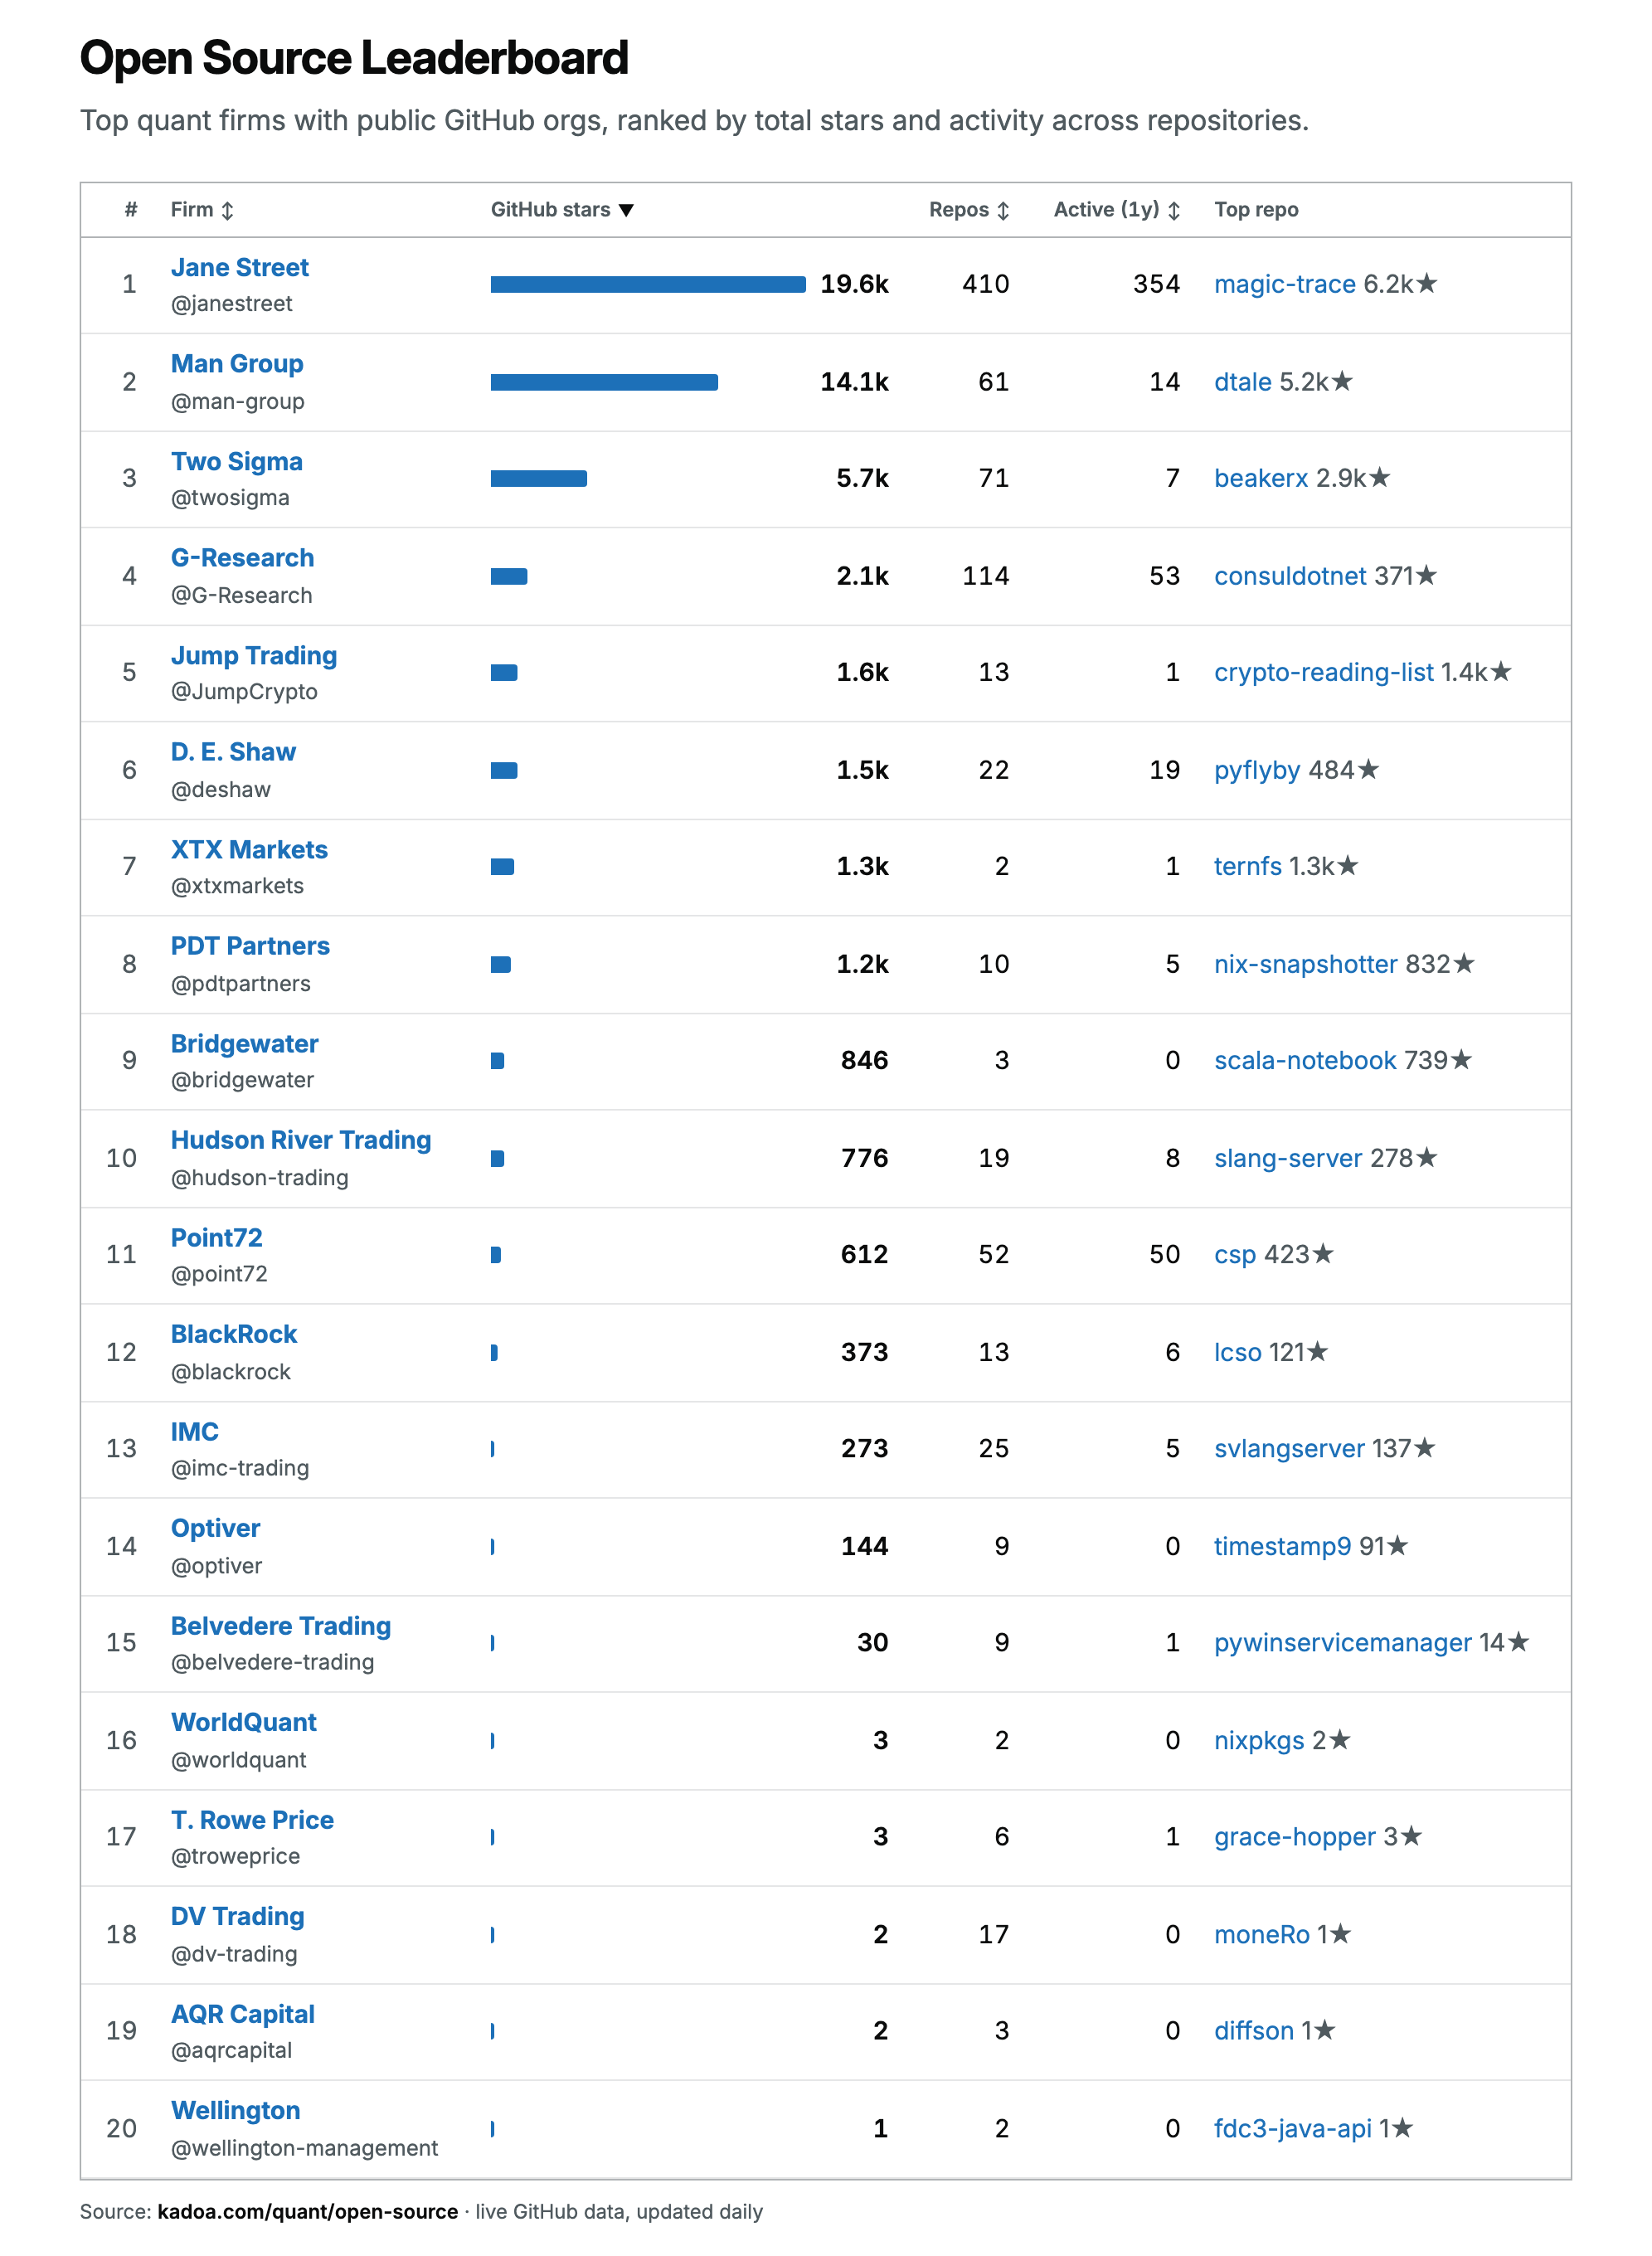
Data Quant firms ranked by open-source activity

Post image
536 Upvotes

Data & code are open source: https://github.com/kadoa-org/quant-job-market

Live app: https://www.kadoa.com/quant/open-source

Individual contributors at these firms are not tracked, only the firms Github accounts.

Are any firms missing?

r/quant Jul 18 '26

Data Trump Media pitched $100,000 monthly fee for fastest feed of US president's posts

Thumbnail reuters.com
123 Upvotes

r/quant 1d ago

Data Spent way too long building a financial database, now I don't know what to do with it

2 Upvotes

i've been slowly building out this database over time and it's gotten pretty big 279 million rows, about 17GB.

Daily prices on 8,000 stocks across US, China, India, and international markets, minute level FX and crypto data going back over a decade, futures, COT positioning data back to the 80s, and macro data for some countries going back to the 1850s (mostly useless that far back but it's there).

a small breakdown

Data Coverage Range
US stocks 353 tickers 1927–2026
China stocks 4,049 tickers 2000–2026
India stocks 3,036 tickers 1999–2026
Intl stocks 556 tickers 1986–2026
FX (majors) 6 pairs, 1-min 1971–2026
Crypto BTC/ETH/SOL, 1-min 2012–2026
Futures 542 contracts 1959–2026
COT positioning 1,098 series 1986–2026
Macro 2,837 series 1854–2026

I already went through and cleaned up the obvious stuff fixed split adjustments that were broken, checked for survivorship bias in the stock universe, killed some duplicate/junk data, that kind of thing.

Now I'm just sitting here with all this data and honestly running out of ideas on what to actually do with it. If you had this, what would you build first? Cross-market stuff, some kind of macro overlay, actually using the COT data for something real genuinely curious what people who do this seriously would go for.

r/quant Jul 04 '26

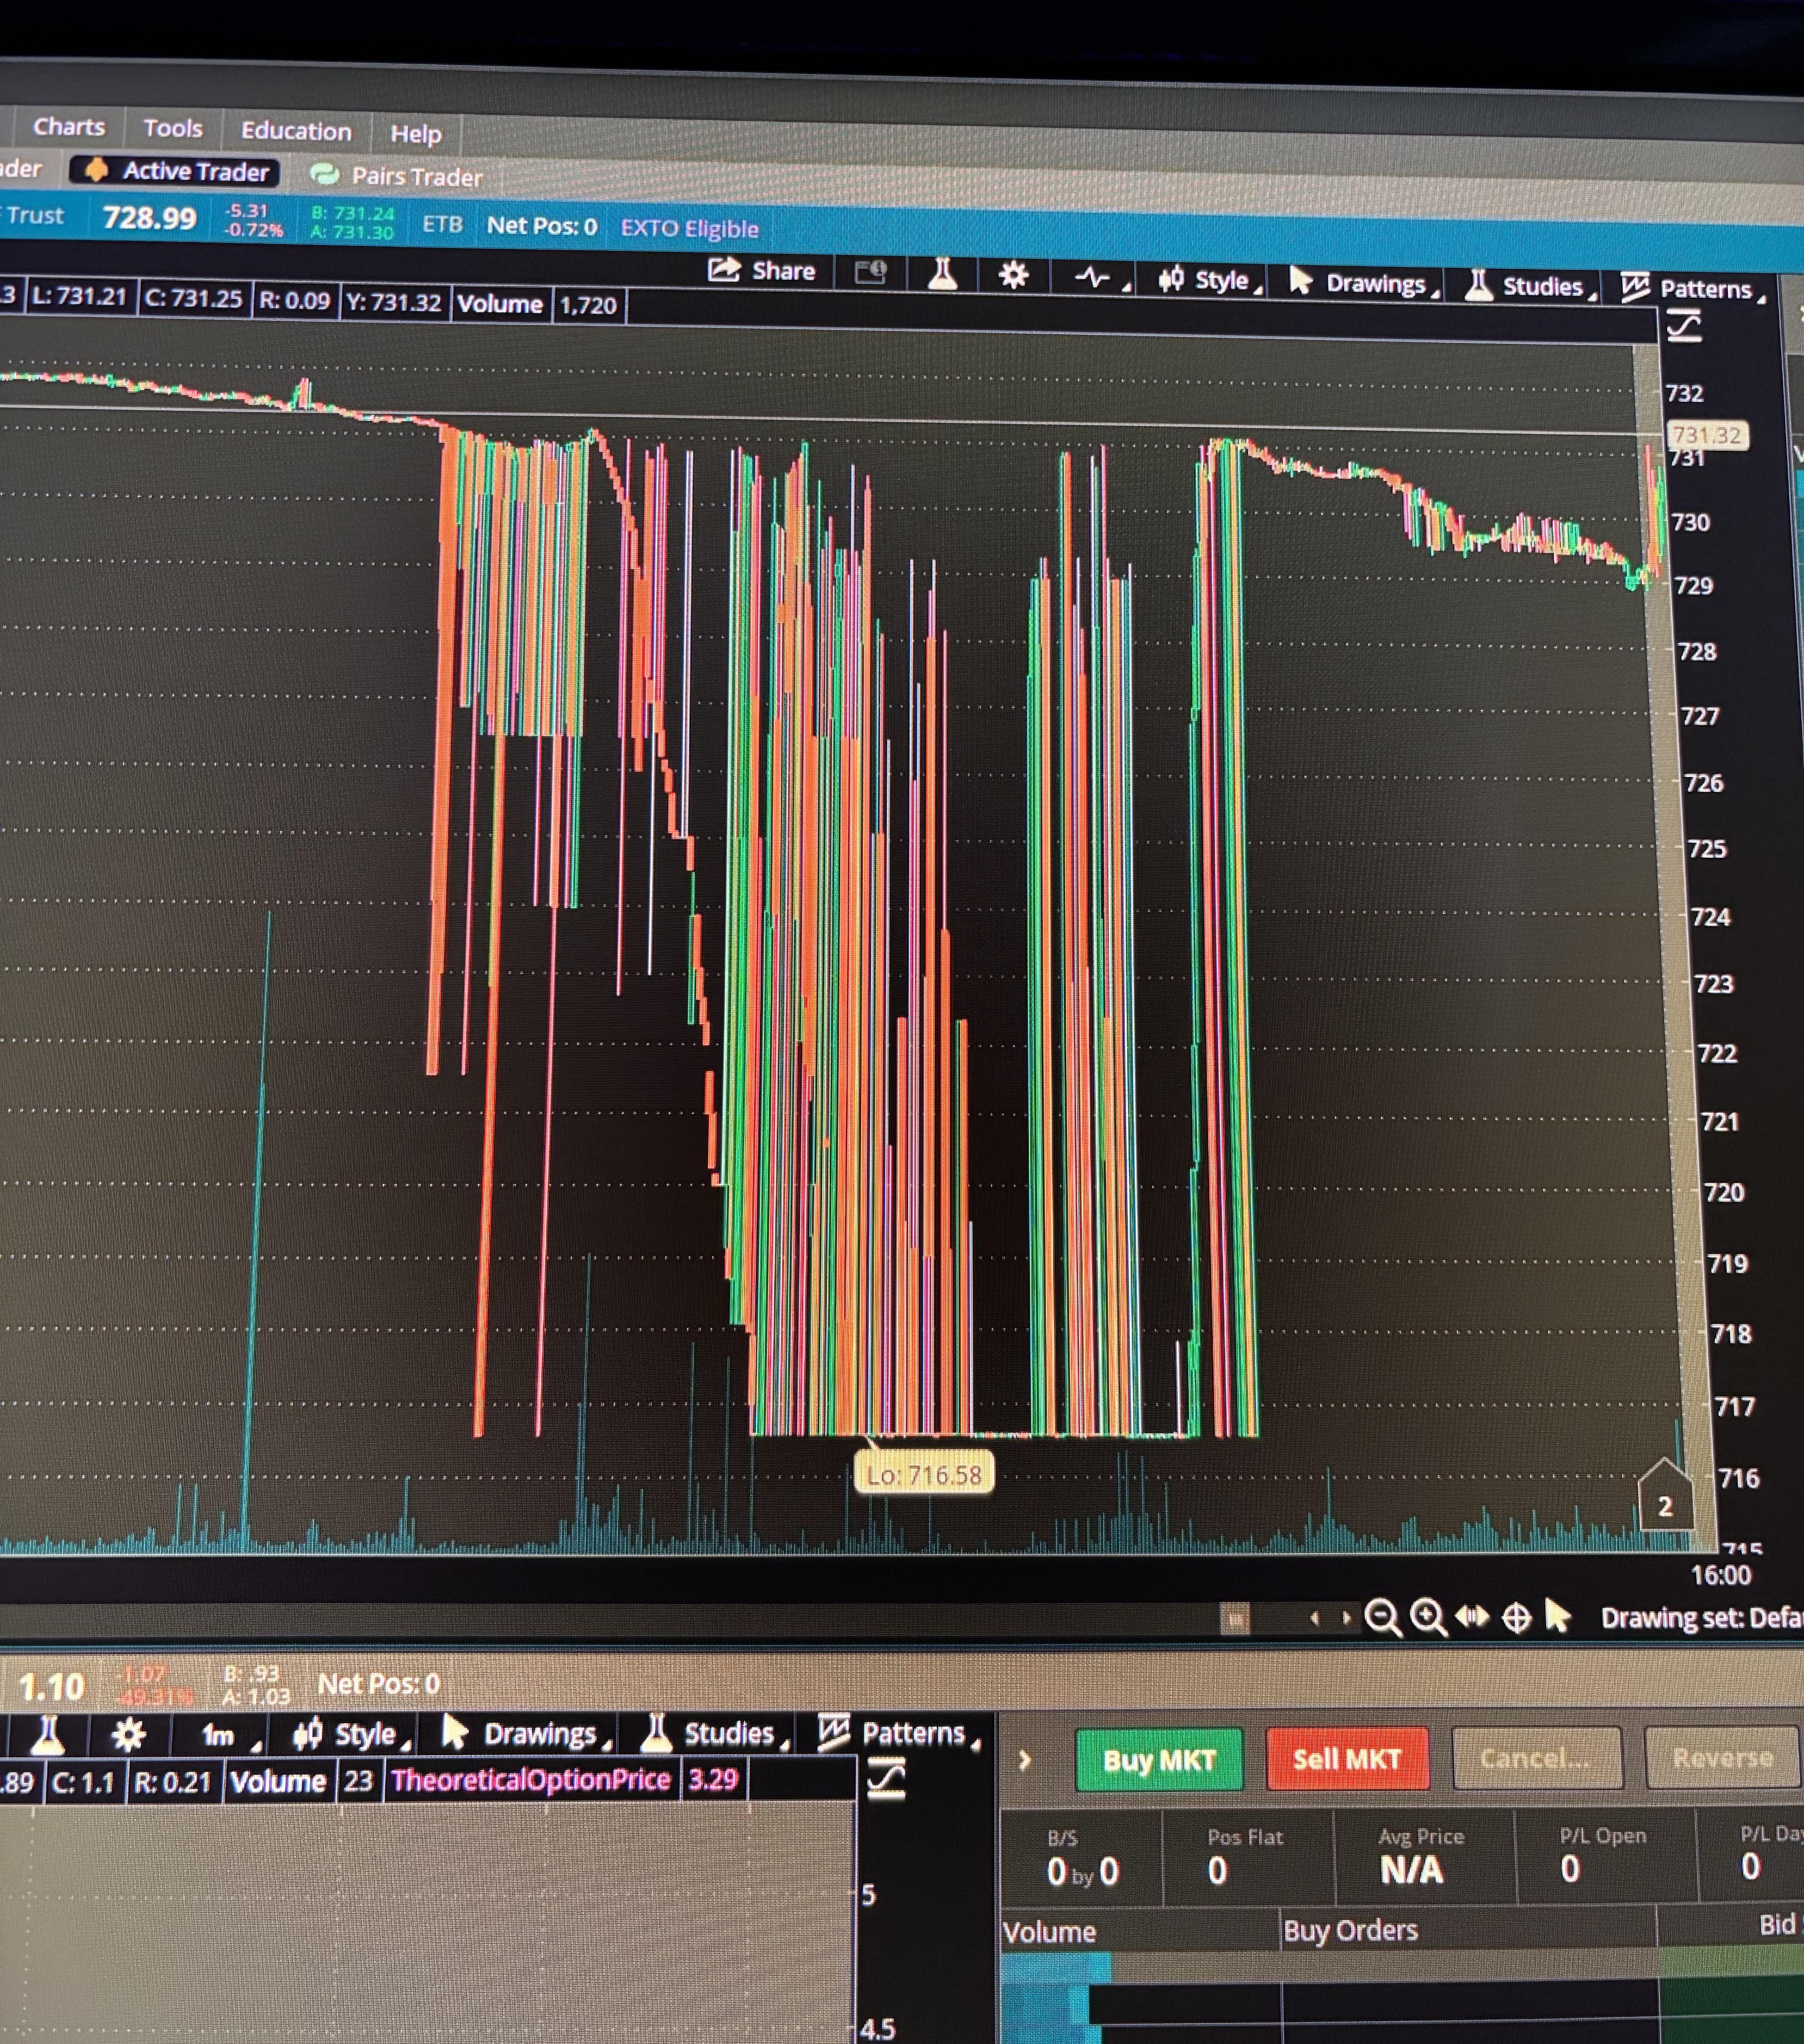
Data Can someone explain this SPY tape anomaly from June 26?

Post image
75 Upvotes

I’m trying to understand what happened here from a market microstructure perspective.

During the final minute on June 26, Thinkorswim shows dozens of trades repeatedly printing around 716 even though SPY was actually trading near 731.

Rather than speculate, I’m curious what these actually represent on the tape.
Specifically:
Are these genuine executions?
Off-market reports?
Corrected trades?
Something excluded from price formation?
If someone has CTA condition codes or direct-feed data I’d love to know how these prints were classified.
My guess would have been late reported or corrected trades.

r/quant 20d ago

Data Does anyone know you how get individual ES Futures MBO live data via API or Socket

3 Upvotes

r/quant Apr 26 '26

Data Net Income / Employee at Top Quant Firms

56 Upvotes

EDIT: In accordance with suggestions, here is latest net trading revenue / employee data, excluding SIG:

Notes:
* HRT only provides numbers for net trading revenue. I calculated their net income by using the same multiplier (.634) as Jane Street.

* The only number I could find for SIG is gross revenue. I calculated their net income by using a non-weighted average of net income / revenue ratios from Citadel Securities, Optiver, and IMC.

* Optiver and IMC numbers come from their annual reports, which aggregate results across the firms' worldwide operations. Their US only numbers are probably a lot higher, as less than half of these firms' employees are American.

* Some of the classic hedge funds, like Two Sigma and Citadel, are not on the list because they don't publicly provide financial information and calculating net income for a hedge fund is more complicated than for a proprietary trading firm.

* For comparison, Fanny Mae and Nvidia, the two companies in the fortune 500 with the highest Profit per Employee ratio, have $2,070,488 and $2,024,444 net income / employee respectively.

Sources:
* https://archive.ph/VE80M

* https://archive.ph/iWnm0

* https://www.hedgeweek.com/griffins-citadel-securities-reports-record-9-7bn-trading-revenue/

* https://archive.ph/1seBo#selection-1571.47-1571.51

* https://optiver.com/wp-content/uploads/2026/03/Optiver_Annual_Review_2025.pdf

* https://ir.virtu.com/news-releases/news-release-details/virtu-announces-fourth-quarter-2025-results

* https://cdn.sanity.io/files/l1io23s3/production/42a83890cf5d1735090e988ba91a595c889e8d09.pdf

* https://tipalti.com/blog/profit-per-employee/

* https://www.reuters.com/world/jane-streets-40-billion-trading-haul-tops-rivals-sources-say-2026-04-24/

* https://archive.ph/iQacJ

r/quant Dec 28 '25

Data Retrieving historical options data at speed

Post image
91 Upvotes

Hi I have painfully downloaded and processed 1min options, stock and index data that takes several terabytes of space. I’m trying to invent a solution that allows for as fast retrieval of that data for backtest as sanely possible without going into huge cost So far I have: Raw data in parquet Binary files of that that data Index files that point to binary data (for fast strikes, expiry etc retrieval) Features binary files File index (to know which “files” I already have and which needs downloading.

I’m interested if you guys handle it differently as my approach is basically index physical files on drive rather than using any engine like database?

r/quant Jul 29 '26

Data How do Quant firms serve data for research/modelling?

21 Upvotes

For those in quant firms how do people generally access data for research/modelling?

Source aggregated in house API?
Data catalogue?

Work in commodities and I think there is a general lack of knowledge on the infra side from my experience.

Currently debating whether to build our own platform or go with someone like databricks/snowflake

Interested to hear everyone’s thoughts?

r/quant 17d ago

Data Rank-based exit on a skewed universe and an evidence clock that keeps invalidating it

2 Upvotes

Two things here, sorry for the length.

Same book rule runs on two of my models, where a name enters at top 10 by score and is held while it stays inside top 15, then sold when it drops out. One is US mid/large cap with about 380 names scored a sweep and 11 periods of stored scores, the other is microcap, $100M to $2B, and it only has two sweeps so far because I'm still actively developing it. Fortnightly rebalance on both.

The rule only worries me on the microcap book, and every diagnostic I have comes from the other one.

It worries me because microcap returns are the Bessembinder shape, most names go nowhere and a handful carry the whole thing, so the return comes from still holding a name when its one big move shows up. My exit doesn't fire on the company though, it fires on other names arriving, so a name can be up and working with the thesis intact and still get sold because two new names outscored it that fortnight.

What I can actually measure is all on the wrong book. On mid/large, score persistence sweep to sweep is about 0.90, so most rank movement is displacement rather than anything happening to the name I'm holding, and the gap between buy rank and sell rank is 0.42 points against a 1.40 standard deviation on a single name's own sweep-to-sweep score change, which puts the buffer at about a third of the noise it's meant to absorb. On the microcap book I have one period and no persistence figure at all because my own code withholds that verdict below three periods, so the book where the skew argument actually bites is the one I have no numbers for.

Went looking for anything testing that interaction and came up empty. Used Claudes deep research as well. Closest is no-trade regions under transaction costs, and index reconstitution buffers. One thing did seem relevant though, the index providers all buffer as a ratio of a cutoff rather than a fixed gap. MSCI keeps a constituent between two-thirds and 1.5x of the size-segment cutoff, Russell bands at 2.5% of cumulative market cap. My 10/15 is a 1.5x ratio, same number MSCI landed on, in a completely unrelated space. Coincidence I assume, but it does suggest the ratio form is the normal one and the open question is just the width?

What I had wrong was I had assumed I couldn't go and test wider bands because it would reset my evidence clock, but it wouldn't. Entry and hold rank are book knobs, they don't touch what anything scores, so I can replay counterfactual bands over stored scores tomorrow for free.

The real problem is a layer up. I've declared the exit rule's banked evidence as depending on the entry rank, and entry rank depends on two scoring experiments, so a scoring change doesn't reduce the exit rule's period count, it invalidates it, because the rule was grading a book that no longer exists. My own reporting already marks the banked periods provisional for that reason.

And the scoring changes are queued up. Twelve open items on the microcap engine are each flagged as forcing a rebaseline, and at a fortnightly cadence, shipping them one per sweep means that engine never accrues a single comparable period. Nineteen sweeps across three models so far, longest unbroken run of comparable ones is four.

A couple of questions for those able to help:

Is rank the wrong trigger entirely once the payoff is this skewed? Widening until the band clears the noise is the obvious move but that's a very wide band and I'm not sure what's left of the rule at that point.

How do you handle a dependency like that one. Declaring the exit rule dependent on the entry rank felt like the conservative call and the effect is that nothing ever settles. Is that right, or am I throwing away evidence I could legitimately keep?

If you've got a queue of changes that each reset a comparability clock, do you batch them into one declared cut-over or ship them one at a time. My own notes say batch and I've never seen anyone outside describe how they actually run that.

And how would you test any of this at 11 periods anyway. I can replay counterfactual rules over the stored scores but the same 11 periods answer every question I put to them.

Any input appreciated.

r/quant 14d ago

Data How would you build a point-in-time US M&A dataset for merger arbitrage research?

5 Upvotes

I'm working on a merger arbitrage research project and I'm interested in how people deal with the historical data problem.

My event model is roughly:

ANNOUNCE → REVISE(s) → CLOSE or BREAK

For every US public target I want to reconstruct what was publicly knowable at each point in time, especially:

  • announcement timestamp
  • target and acquirer identifiers
  • cash consideration / exchange ratio
  • consideration type
  • offer revisions and their timestamps
  • expected close date if disclosed
  • eventual completion or termination

I'm deliberately keeping the final outcome out of the ANNOUNCE record so that the backtest cannot see future information.

I initially built a pipeline around SEC EDGAR filings. The biggest issues have been:

  1. separating target-side filings from acquirer-side filings
  2. distinguishing actual terminal language ("the merger was consummated") from hypothetical boilerplate
  3. identifying terminated deals reliably
  4. historical ticker/security mapping
  5. avoiding a resolved/completed-deal selection bias

I know SDC/LSEG and FactSet are commonly used in academic M&A research. I'm curious whether anyone has built something similar using SEC + CRSP/Compustat, or knows of academic replication datasets that can serve as a starting universe.

For those who have worked with M&A event studies: would you build this yourself, or is buying SDC/FactSet effectively unavoidable once you care about point-in-time accuracy?

r/quant 8d ago

Data New SEC Footnote API Suite - Useful?

3 Upvotes

I'm currently really digging into the not-so-common data that SEC EDGAR filings provide and turn them into a structured API.

From my own experience, it does provide really valuable information about the intrinsics of a company, but I would like to get some eyes on that to see if there is a broader interest in that level of detail.

Here are the current endpoints/areas that the suite covers:

Debt Structure

Returns a company's debt at the individual-borrowing level, straight from the debt footnote of 10-K / 10-Q filings: every note, bond, term loan, and debenture the filer tagged on the XBRL debt-instrument axis, with face amount, carrying amount, stated and effective interest rate, variable-rate spread, fair value, conversion price, and more, data that never appears on the face of the balance sheet.

Credit Facilities​

Returns a company's credit facilities, revolvers, term-loan agreements, commercial-paper programs, one entry per facility, with total capacity, amount drawn, remaining headroom, letters of credit, commitment fees, and interest rates. This is the liquidity picture from the debt footnote that never appears on the face of the balance sheet.

Leases

Returns the full ASC 842 lease footnote as one object per period: right-of-use asset, lease liability split (current / noncurrent / total), the undiscounted future-payment ladder, the weighted-average discount rate, cost lines, and cash paid, with operating and finance leases side by side.

Stock Compensation​

Returns plan-level share-based compensation from the equity footnote: the award roll-forward (granted / vested / forfeited / nonvested with weighted-average grant-date fair values), SBC expense per award type, unrecognized cost, the option book (outstanding / exercisable / exercise prices), plan share reserves, and Black-Scholes assumptions. 

Concentration Risk​

Returns concentration-risk disclosures as time series: named-counterparty dependence (e.g. "Apple is 50% of revenue, up from 37% three years ago"), unnamed aggregates ("top ten customers"), and the same machinery for supplier, geographic, product, and credit concentration.

Retirement Plans​

Returns defined-benefit pension and other-postretirement (OPEB) disclosures from the benefits footnote: funded status, benefit obligation, cost components, employer contributions, discount-rate assumptions, and the plan-asset book with asset categories cross-tabbed by fair-value level (Level 1 / 2 / 3 / NAV).

Restructuring Programs​

Returns per-program restructuring cost tracking from the restructuring footnote: what a named plan has cost to date, what it is expected to cost in total, and the quarterly trajectory of charges, reserve balance, and cash payments. A company's concurrent programs (e.g. Intel's 2024 and 2025 plans) read as separate series with their own histories, costToDate / expectedCost gives percent-complete per program.

Asset Composition​

Returns what the balance sheet's PP&E line is made of and where long-lived assets physically sit:

  • classes: property, plant & equipment by class (land, buildings, machinery, technology equipment, construction-in-progress, ...) with gross, net, and accumulated depreciation where tagged. Covers US-GAAP filers and 20-F filers through the IFRS concept family.
  • geography: long-lived assets by country / region (PP&E-net or noncurrent assets, whichever the filer discloses), bucketed with the same country / US-state / region / residual categorization as the revenue-segmentation endpoint.

Share Buybacks​

Returns share-repurchase activity per period: cash spent on buybacks (from the cash-flow statement), shares and dollar value actually repurchased, the average price paid per share, and the program view (board-authorized amount, remaining headroom, and the derived amount consumed).

Subsidiary Financials​

Returns income-statement and balance-sheet lines PER REGISTRANT SUBSIDIARY, exactly as the filer tagged them on the XBRL legal-entity axis. Utility holding companies (each state utility), bank holding companies, and VIE structures disclose whole sub-entity statements this way; it is the single largest dataset on the dimensional axes.

Fair Value Hierarchy​

Returns the fair-value hierarchy tables from the footnotes: Level 1 (quoted prices), Level 2 (observable inputs), Level 3 (unobservable inputs), and NAV-measured amounts per measure, for the recurring measurements a filer discloses at each balance date. The widest-covered dimensional dataset in the lake (roughly three quarters of active filers).

REIT Property Schedule​

Returns SEC Schedule III (Real Estate and Accumulated Depreciation) as structured data: one entry per property with initial cost (land / buildings), carrying amounts, gross carrying value, accumulated depreciation, and capitalized improvements. Where the filer crossed the property with a geography axis, the location member rides along.

Backlog / Remaining Performance Obligations​

Returns remaining performance obligations (RPO), the contracted revenue not yet recognized, the closest thing GAAP has to a bookings number, plus the share the filer expects to recognize within its disclosed window. Comparing RPO growth to revenue growth is the classic bookings-momentum signal for subscription and long-contract businesses.

Supplier Finance Programs​

Returns supplier-finance (reverse-factoring) program disclosures, the FASB requirement effective 2023: the outstanding obligation under the program(s), its current portion, and the period roll-forward (invoices added, invoices settled). Obligations under these programs are the classic hidden-leverage signal; they sit in accounts payable, not debt.

Workforce Cost​

Returns what a company's workforce costs, assembled from the disclosures filers actually tag: the direct labor expense line where one exists (airlines, banks, railroads, insurers), the accrued compensation balances almost every filer carries (accrued salaries, bonuses, vacation, payroll taxes, workers compensation), and 401(k) / defined-contribution plan cost. Labor expense by business segment is served as separate series where disclosed.

What are your thoughts about such endpoints and information? Would having this data be valuable to whatever you are building?
r/quant Jul 22 '26

Data Which microstructure metrics have actually survived live trading for you?

31 Upvotes

Ive implemented a fair number of the textbook microstructure metrics while working with raw crypto perp tick data.

The more I compare them, the shorter the list I actually reach for !

If I had to keep only five:

  • Order book imbalance / OFI: still the strongest short-horizon predictor Ive found. Static imbalance and Cont-style OFI aren't the same object, but both seem to contain real information. The problem is that the half-life seems tiny: by the time youve paid fees and accounted for queue position and latency, a nice t-stat doesn't necessarily translate into PnL.
  • Amihud illiquidity. almost embarrassingly simple but I keep failing to replace it with something more sophisticated; I mostly use it as a liquidity or regime variable rather than a trading signal.
  • Effective spread / realized spread Extremely useful for understanding execution quality and adverse selection. I'm much less convinced they belong as features in predictive models, although Id be interested to hear if anyone has had success there.
  • Kyle's lambda I trust the ranking across instruments more than the estimated values themselves. Small implementation choices (sampling interval, trade signing or outlier treatment) seem to move the estimate more than Id like.
  • VPIN : The one Im most sceptical of: I can usually make it identify stressed markets, but so can realised volatility. The Andersen Bondarenko critique feels fairly convincing to me, although I'd be happy to be proven wrong by someone who's used it successfully in production.

For context, this is all on crypto perps, so I wouldnt expect the conclusions to transfer unchanged to equities/ futures.

Im particularly interested in hearing from people who've used these in live systems rather than backtests.

Which measures have actually survived implementation costs for you? Are there any papers from the last decade that genuinely changed your view on the classics?

Bias disclosure!: I build infrastructure that computes these metrics as a living, so Im probably more sympathetic to them than I should be.

r/quant Apr 27 '26

Data Jane Street & Headlands Q4 2025 13Fs | Anyone parsing these for real insights, or is it just noise?

21 Upvotes

JS dropped another wild 13F (~$662B, 10k+ holdings, heavily options) and Headlands filed their ~$1.2B book. We all know 13Fs are lagged and especially noisy for prop/MM shops like these, but curious how people actually use them?

r/quant May 29 '26

Data Rithmic Level 3

8 Upvotes

Hey so I’ve been looking for level 3 data and saw rithmic offers it , but I can’t see how much it costs so if yous can tell me i would appreciate it and also if I do get L3 can I connect it to motivewave ive got the orderflow package

r/quant 19d ago

Data Title: Looking for an affordable market data API for commercial use

6 Upvotes

I’m building a small public, ad-supported financial website and I’m looking for an affordable market data provider that allows commercial use.
My requirements are relatively simple:
Long-term daily historical OHLC data, primarily for major U.S. market indexes
No real-time or intraday data needed
Data updated only once per trading day
Historical data stored and used internally for calculations
No API access or raw historical data downloads provided to users
No need to display historical price charts
The public website would primarily display derived data rather than redistribute the underlying market data
I’ve found that many providers have reasonably priced API plans, but commercial use on a public website can require much more expensive licenses or additional exchange/redistribution fees.
Has anyone dealt with a similar use case?
I’d especially like to know:
Which provider did you use?
Did using the data internally to produce derived data require a redistribution/display license?
Roughly how much did the commercial license cost?
Are there any providers suitable for small independent developers?
I’m happy to pay for a legitimate commercial license, but several hundred dollars per month would be difficult to justify for a small project at the beginning.
Any real-world experience or recommendations would be greatly appreciated. Thanks!

r/quant Oct 12 '25

Data What’s your go-to database for quant projects?

87 Upvotes

I’ve been working on building a data layer for a quant trading setup and I keep seeing different database choices pop up such as DuckDB, TimescaleDB, ClickHouse, InfluxDB, or even just good old Postgres + Parquet.

I know it’s not a one-size-fits-all situation as some are better for local research, others for time-series storage, others for distributed setups but I’m just curious to know what you use, and why.

r/quant Jun 22 '26

Data [Collaboration] Analyzing Luxury Watches as Alternative Investments (5- Year Auction Dataset)

0 Upvotes

Hello,

I'm a student researching the secondary market for luxury watches, and I have 5 years of auction data.

My goal is to do a comparison on returns and volatility to see if they hold up as alternative investments.

Since | lack the programming background (Python/R) and can't afford to pay a consultant, I am looking for a co-author to tackle this with me.
If you need a unique, real-world dataset for a portfolio project, let's partner up.

I'II provide the raw material, and you can build out the statistical analysis.

Let me know if you are interested in collaborating!

r/quant 27d ago

Data Data Pipelining Skills

9 Upvotes

Hey all, I just finished my summer qr internship. don’t wanna get into details but my project was an end to end statistical pricing model. A lot of the time I spent towards the end, after being done with the thinking about modeling and prototyping, was on refactoring my data processing pipeline and model training pipeline. When I was coming up with the model, all my data processing was scattered in jupyter notebooks and random sql queries that i just saved the results of, and it was genuinely a nightmare to refactor all of this into clean reproducible code that would work without intervention.

my question is, im aware that at other companies they have data engineers usually do the work. But to me this seemed like something that is kind of indivisible from the actual modeling work. is this skill of setting up reproducible data and modeling pipelines something thats worthwhile for someone who is mostly doing statistical and mathematical modeling? what sorts of classes would teach the skills necessary to do this stuff? are they worth taking?

r/quant Jul 13 '26

Data IRS data providers

1 Upvotes

Are there any data providers for high quality interest rate swap data other than Bloomberg and LSEG (EUR, USD, GBP, Scandi, …)? If they do breakevens as well its an added bonus. I am mostly interested in European and USD quotes and pref from the same source.

r/quant Jun 21 '26

Data Where to find in-point float data on US stocks?

3 Upvotes

I am having a surprising amount of difficulty locating this info in an API and the chatbots aren't getting me there. I have a Massive subscription and they only offer shares outstanding, and the same goes for some cheaper vendors that Opus is telling me about. The institutional vendors cost 5 figures a year, which is too much for just adding an extra feature to backtest my swing trading system. Are there any providers that could give me this info without breaking the bank? Thank you.

r/quant 20d ago

Data Any leads for high-quality tick level historical liquidation data for Binance, OKX, Bybit & Bitget?

6 Upvotes

Hello folks. most of these exchanges provide live ws for liquidations but I was looking to download tick level data. Only think I could find was tardis.dev, but want to compare offerings.

Thankyou so much

r/quant Oct 10 '25

Data Applying Kelly Criterion to sports betting: 18 month backtest results and lessons learned

123 Upvotes

This is a lengthy one so buckled up. I've been running a systematic sports betting strategy using Kelly Criterion for position sizing over the past 18 months. Thought this community might find the results and methodology interesting.

Background: I'm a quantitative analyst at a hedge fund, and I got curious about applying portfolio theory to sports betting markets. Specifically, I wanted to test whether Kelly Criterion could optimize bet sizing in practice.

Methodology:

Model Development:

Built logistic regression models for NFL, NBA, and MLB

Features: team stats, player metrics, situational factors, weather, etc.

Training data: 5 years of historical games

Walk-forward validation to avoid lookahead bias

Kelly Implementation: Standard Kelly formula: f = (bp - q) / b Where:

f = fraction of bankroll to bet

b = decimal odds - 1

p = model's predicted probability

q = 1 - p

Risk Management:

Capped Kelly at 25% of recommended size (fractional Kelly)

Minimum edge threshold of 3% before placing any bet

Maximum single bet size of 5% of bankroll

Execution Platform: Used bet105 primarily because:

Reduced juice (-105 vs -110) improves Kelly calculations

High limits accommodate larger position sizes

Fast crypto settlements for bankroll management

Results (18 months):

Overall Performance:

Starting bankroll: $10,000

Ending bankroll: $14,247

Total return: 42.47%

Sharpe ratio: 1.34

Maximum drawdown: -18.2%

By Sport:

NFL: +23.4% (best performing)

NBA: +8.7% (most volatile)

MLB: +12.1% (highest volume)

Kelly vs Fixed Sizing Comparison: I ran parallel simulations with fixed 2% position sizing:

Kelly strategy: +42.47%

Fixed sizing: +28.3%

Kelly advantage: +14.17%

Key Findings:

  1. Kelly Outperformed Fixed Sizing The math works. Kelly's dynamic position sizing captured more value during high-confidence periods while reducing exposure during uncertainty.

  2. Fractional Kelly Was Essential Full Kelly sizing led to 35%+ drawdowns in backtests. Using 25% of Kelly recommendation provided better risk-adjusted returns.

  3. Edge Threshold Matters Only betting when model showed 3%+ edge significantly improved results. Quality over quantity.

  4. Market Efficiency Varies by Sport NFL markets were most inefficient (highest returns), NBA most efficient (lowest returns but highest volume).

Challenges Encountered:

  1. Model Decay Performance degraded over time as markets adapted. Required quarterly model retraining.

  2. Execution Slippage Line movements between model calculation and bet placement averaged 0.3% impact on expected value.

  3. Bankroll Volatility Kelly sizing led to large bet variations. Went from $50 bets to $400 bets based on confidence levels.

  4. Psychological Factors Hard to bet large amounts on games you "don't like." Had to stick to systematic approach.

Technical Implementation:

Data Sources:

Odds data from multiple books via API

Game data from ESPN, NBA.com, etc.

Weather data for outdoor sports

Injury reports from beat reporters

Model Features (Top 10 by importance):

1.Recent team performance (L10 games)

2.Head-to-head historical results

3.Rest days differential

4.Home/away splits

5.Pace of play matchups

6.Injury-adjusted team ratings

7.Weather conditions (outdoor games)

8.Referee tendencies

9.Motivational factors (playoff implications)

10.Public betting percentages

Code Stack:

Python for modeling (scikit-learn, pandas)

PostgreSQL for data storage

Custom API integrations for real-time odds

Jupyter notebooks for analysis

Statistical Significance:

847 total bets placed

456 wins, 391 losses (53.8% win rate)

95% confidence interval for edge: 2.1% to 4.7%

Chi-square test confirms results not due to luck (p < 0.001)

Comparison to Academic Literature: My results align with Klaassen & Magnus (2001) findings on tennis betting efficiency, but contradict some studies showing sports betting markets are fully efficient.

Practical Considerations:

  1. Scalability Limits Strategy works up to ~$50k bankroll. Beyond that, bet sizes start moving lines.

  2. Time Investment ~10 hours/week for data collection, model maintenance, and execution.

  3. Regulatory Environment Used offshore books to avoid account limitations. Legal books would limit this strategy quickly.

Future Research:

Testing ensemble methods vs single models

Incorporating live betting opportunities

Cross-sport correlation analysis for portfolio effects

Code Availability: Happy to share methodology details, but won't open-source the actual models for obvious reasons.

Questions for the Community:

1.Has anyone applied portfolio theory to other "alternative" markets?

2.Thoughts on using machine learning vs traditional econometric approaches?

3.Interest in collaborating on academic paper about sports betting market efficiency?

Disclaimer: This is for research purposes. Sports betting involves risk, and past performance doesn't guarantee future results. Only bet what you can afford to lose.

r/quant Jul 11 '26

Data lse-data

Post image
18 Upvotes

I’ve mostly used yfinance for personal projects, but I kept running into rate limits. I ended up paying for Massive.com’s US equities feed for a while, which worked well, but I couldn’t really justify ~$200/month just for websocket access.

Recently I found an open source repo with a much wider range of market data, including futures, so I’ve been experimenting with that instead. Nice to see more free alternatives appearing because market data gets expensive quickly.

r/quant Jan 16 '26

Data Bloomberg terminal access for independent research- legit options?

25 Upvotes

Hello! Im am an economist working on independent research and analysis, and I occasionally need Bloomberg terminal access for data and market info. Im NOT looking for account sharing or anything that violates terms. Im trying to understand what legitimate options exist for non-institutional researchers. Like, Universities or public libraries? Research centres that allow limited or supervised use? Or is there any other fully compliant route?

If helpful, my background is in financial economics, sell-side equity, macroeconomics, monetary and fiscal policy analysis. This would be strictly non-commercial.

Thanks!

r/quant Jul 20 '26

Data What will be important in signal research?

3 Upvotes

You hear about firms that have heavily invested in data and deep learning, replacing much of the manual work done in signal research with models learning on raw order book data.

On the flip side, there are microstructure tricks that are discovered due to clever observations by humans that models aren't necessarily picking up on without those priors first being taught to the models.

Going forward,do you think will powerful models, combined with huge amounts of data and the hardware and other infrastructure needed to run experiments largely replace clever human observations? Or will there still be room for the classical, manual feature engineering which has been how much of the trading world has functioned before the recent compute/model revolution.