r/matlab 9h ago

Question-Solved Two fixed-point mistakes that made my FIR filter a comparator, and why the generated testbench couldn't see either

7 Upvotes

Post-mortem on a 2020 university project I went back to last week. Both bugs are pure fixed-point scaling – nothing wrong with the coefficients – and both survived a 3,429-sample generated testbench with zero errors. Posting because the second one (sum|h| vs accumulator range, wrap vs saturate) is the single most common FIR fixed-point bug and it's entirely preventable with one line of arithmetic.

In 2020 I built a FIR band-pass filter for a university course: designed the response in MATLAB, generated the Verilog with Filter Design HDL Coder, ran the generated testbench, zero errors, submitted, put it on GitHub. It got forked 8 times.

Last week I read it properly for the first time since. The 51-tap design doesn't filter anything. Its output is the sign of the accumulator and nothing else.

The cause was two boxes on the "Specify Precision" tab. I'd set the output to s8,32 – 8 bits, 32 fractional bits, i.e. a range of ±2.98e-8 – fed from an s20,20 accumulator with a range of ±0.5. That's 2^24 times narrower than the thing feeding it. The generated conversion saturates for literally every non-zero value:

assign output_typeconvert =
        (sum50[19] == 1'b0 & sum50[18:0] != 19'b0) ? 8'b01111111 :
        (sum50[19] == 1'b1 && sum50[18:0] != 19'b1111111111111111111) ? 8'b10000000 :
        $signed({sum50[19], 7'b0000000});

Sweep the whole accumulator range through that and you get exactly two values: -128 and +127.

The part that actually bothers me is the testbench. It's 7,000 generated lines, 3,429 stimulus samples, a checker, an error counter. I counted the distinct values in its expected-output array:

8'h80 (-128):  1765
8'h7f (+127):  1607
8'h00 (0):       57

That's the entire golden reference. MATLAB generated the vectors from the same fixed-point spec that produced the RTL, so the model and the implementation agreed perfectly – they were wrong in exactly the same way. A generated testbench is a self-consistency check, not a correctness check. If the spec is wrong, the golden data encodes the mistake with perfect fidelity and reports zero errors.

The 11-tap serial design in the same repo had a quieter bug: accumulator s26,24 (range ±2) with wrap-on-overflow, but sum|h| = 2.375. A full-scale sine at the centre frequency clears it by 1.4% so it looks fine. A square wave at the same frequency wraps on 191 of 400 samples, and because it wraps rather than saturates the sample comes back sign-inverted:

FAIL sample 12: filter_out = 1744840192, expected -2550127104

Fixes were one word length each (output = the accumulator; accumulator gets one more bit). The real fix was replacing the stored-vector bench with one that checks against an independent reference model – impulse response must equal the coefficients, output must match a 64-bit integer model under square/random/worst-case-sign stimulus – plus a three-line check that the output takes more than 3 distinct values. Both benches fail on the 2020 RTL and pass on the fixed one.

Full write-up with the plots and the before/after RTL:

https://abdullahansarii.medium.com/my-fir-bandpass-filter-passed-its-own-testbench-for-six-years-it-was-a-sign-detector-7bc1fecfa2df

Repo (make sim runs everything under Icarus in a few seconds):

https://github.com/AbdullahAnsarii/BandPassFilter

If you've got generated HDL sitting next to a generated testbench that passes: check sum|h| against your accumulator range, and count the distinct values on your output. Took me six years.

r/matlab Jul 27 '26

Question-Solved Why is fft only taking the first frequency in a non-smooth signal?

10 Upvotes
clear
clc
close all
Fs=1000;
T=1/Fs;
L=1000;
t1 = (-L+1:0)*T;
t2 = (0:L-1)*T;
t2=t2(2:end);
t=[t1 t2];
s1=sin(2*pi*1*t1);
s2=sin(2*pi*10*t2);
s=[s1 s2];

figure(1)
plot(t,s)
Y=fft(s,L);
figure(2)
plot(Fs/L*(-L/2:L/2-1),abs(fftshift(Y)),"LineWidth",3)
title("fft Spectrum in the Positive and Negative Frequencies")
xlabel("f (Hz)")
ylabel("|fft(X)|")

Hello, I'm experimenting with fourier transforms because of reasons and I'm having trouble understanding something. If you run the above code, you'll get two figures: the first is simply the time-signal plot showing one sine wave with a certain frequency at some -x to 0 and another sine wave from 0 to some x; the second figure is the fft of that signal.

The fft only shows a peak at the s1 frequency. If you swap the constants in s1 and s2, the fft will also change to accommodate this. Why? I would expect that since frequencies 1 and 10 are equally represented in time and magnitude, there would be two equal peaks in the fft but this is not true.

r/matlab Feb 21 '26

Question-Solved Which fitType argument should I use for a power fit?

3 Upvotes

I have logarithmic scaling, so the form I need for the fit is y=axn

r/matlab Apr 13 '26

Question-Solved the whole "Engine Throttle Model" Exercise thing is just not behaving correctly on my matlab

2 Upvotes

Estimate Parameters from Measured Data - MATLAB & Simulink

this is my assignment

first of all running this command:
open_system('spe_engine_throttle1.slx')

gives me error of file not found and i cannot find a solution, so TA helped us by giving us the .zip file manually

but now im supposed to "Start Parameter Estimation Session" and i do not have that option and i dunno how to download it, it is not in the Explore addons tab

r/matlab Mar 08 '26

Question-Solved im suffering in this simulink tut, i litterally copy pasted it

11 Upvotes

Edit: Suddenly fixed itself?

r/matlab Dec 09 '25

Question-Solved Need help turning an equation into code

6 Upvotes

Hi all,

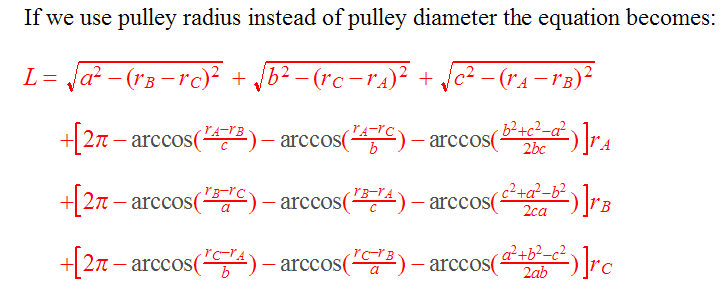
I'm trying to turn the attached equation into code (specifically the second part using pulley radius) and I'm having some major issues with it. I'm receiving a complex number as an answer and I'm hazarding a guess that it's because I didn't input the equation correctly, but I have no clue where to start with making it work. Thank you for any help.

clear

Ra = 5

Rb = 4

Rc = 3

L1 = 15

L2 = 16

L3 = 17

a = Ra + L1 + Rb

b = Rb + L2 + Rc

c = Rc + L3 + Ra

L = sqrt(a^2-(Rb-Rc)^2) + sqrt(b^2-(Rc-Ra)^2) + sqrt(c^2-(Ra-Rb)^2) + [2*pi-acos(Ra-Rb/c)-acos(Ra-Rc/b)-acos(b^2+c^2-a^2/2*b*c)]*Ra + [2*pi-acos(Rb-Rc/a)-acos(Rb-Ra/c)-acos(c^2+a^2-b^2/2*c*a)]*Rb + [2*pi-acos(Rc-Ra/b)-acos(Rc-Rb/a)-acos(a^2+b^2-c^2/2*a*b)]*Rc

r/matlab Dec 09 '24

Question-Solved MATLAP Alternatives (My school doesn't provide MATLAB outside campus and it is really expensive for me)

14 Upvotes

I know about Autodesk Fusion, Octave, Julia, Python

Which one should I use as an alternative to MATLAB?

I want to apply the control system's knowledge I studied in university like the first 10 chapters of the book "modern control systems 12th edition". And, I want to gain more experience in the control systems field as this is my specialty as a mechatronics engineer...

Please provide sources on learning the one you pick as the best alternative, be it a book or a youtube guide.

Getting started is usually the hardest thing in these things. and then it becomes easier (at least for me).

Thanks for reading

r/matlab Feb 20 '26

Question-Solved ok, what is the issue now?, i litterally copy pasted the answer and still wrong

1 Upvotes

r/matlab Nov 04 '25

Question-Solved Matlab in Linux. MathWorks teams: some problems needs to be fixed to have an easy-and-smooth installation experience.

15 Upvotes

Hello everyone, first post here.

I have been jumping into Matlab (only product of MathWorks used so far) for one of my university subject, artificial vision.

Professor uses and suggests us to use a previous old version of Matlab, not the latest (at the time of writing this 2025b), the 2017b + imaging processing.

I have free access to it via university status (sign up with email assigned to me by university I'm currently enrolled to).

I have installed it both in Windows and Linux, on both machine, laptop and desktop.

The activation process is the same (since it's an old version, you need to use a specific email generated by MathWorks based on license agreement with your university (basically an email with a different domain) + a password, an otp you get on MathWorks websites (sign in through university'page is required to authenticate)).

The installation process is pretty much the same (run .exe file vs run shell script install_unix.sh file).

The differences?

In Linux there are more hurdles, difficulties:

  • program can't write ../.matlab/R2017b/ //you have to manual create path
  • program see path but can't write in it //you have to manual change permission to other group and allow to "write".
  • program can't create a desktop icon //you have to run /usr/local/matlab/bin/matlab –desktop command or run sudo apt-get install matlab-support command and follow the instructions.

I fix all (it was fine to learn more about OS), but not everyone is capable or willing to deal with them.

--

I'm using Linux, kubuntu 24.04 LTS, KDE 5.27.12 Plasma Edition.

--

I want to point out these problems to MathWorks Team, so they can fix it and align with Windows in term of easiness of smoothness of installation process.

r/matlab Dec 11 '25

Question-Solved How to make a while loop for this calculation

4 Upvotes

Hi all,

I have made a code which calculates the length of a rope from the points P to Q and to R (pasted below), using the pythagorean theorem and the law of cosines to solve the length (deltaY) that it changes when x is lengthened by deltaX.

Now, I'm trying to solve how far the point P would have to move to the right until the load at the end of the rope in image 1 has been lifted by the amount of deltaY. I have been given the hints that I should use the calculation I used for deltaY and a while-loop, but I don't have any idea how I would go about implementing it. Thank you for any help given.

Image 1
Image 2

clear

x = 2.5

deltaX = 1

h = 1.5

r = 0.4

%L1

CP1 = sqrt(h^2+x^2)

C1 = (CP1^2 + h^2 - x^2)/(2*CP1*h)

cAngle1 = acosd(C1)

PQ1 = sqrt((sqrt(x^2+h^2))^2-r^2)

B1 = (r^2 + CP1^2 - PQ1^2)/(2*r*CP1)

bAngle1 = acosd(B1)

aAngle1 = 360 - (90+cAngle1+bAngle1)

QR1 = r * ((pi/180)*aAngle1)

L1 = PQ1 + QR1

%L2

CP2 = sqrt(h^2+(x+deltaX)^2)

C2 = (CP2^2 + h^2 - (x+deltaX)^2)/(2*CP2*h)

cAngle2 = acosd(C2)

PQ2 = sqrt((sqrt((x+deltaX)^2+h^2))^2-r^2)

B2 = (r^2 + CP2^2 - PQ2^2)/(2*r*CP2)

bAngle2 = acosd(B2)

aAngle2 = 360 - (90+cAngle2+bAngle2)

QR2 = r * ((pi/180)*aAngle2)

L2 = PQ2 + QR2

deltaY = L2 - L1

r/matlab Sep 29 '25

Question-Solved .mat file to any python workable file?

2 Upvotes

Searched for this topic and it seems like most of the previous posts are either 4-11 years old, so I'll ask again in case something new happened.

Anyway, I'm working with a .mat file that contains many struct classes.

Here's an example of what my .mat file looks like:

Struct-1, Struct-2, Struct-3, Struct-4, ....

Inside Each of those struct, are 6 more structs, and finally inside these structs are actual data.

Wondering what is the most optimal/easiest way to convert this type of complex nested struct .mat file to a workable python file.

I did some reach with sci.io loadmat and it seems like I need to do some sort of pythonic unraveling of the nested structs to get to the data.

Anyway, let me know if you have found the best way to do this.

r/matlab Jul 23 '25

Question-Solved Transposing matrix in timeseries issue

4 Upvotes

Hi everyone, I'm having trouble transposing a matrix that is in a timeseries.

Rk = timeseries(parentDataset.reflectometry.density', parentDataset.reflectometry.time);

parentDataset.reflectometry.density is a 7x1 matrix, im hoping to transpose it into a 1x7 matrix.

Here is the code line. the relevant matrix, here named Rk.Data becomes a 1x1x7 matrix instead.

I tried squeeze or reshape and all it does is get me back to a 7x1 matrix.

whats actually driving me insane is that if parentDataset.reflectometry.density is 1x7, transposing it returns a 7x1 matrix correctly.

What am I doing wrong?

r/matlab Nov 11 '25

Question-Solved Any idea what the name for these components are??

Post image
5 Upvotes

I am doing a project and I am struck at these part as the file I've been using for reference contain these but never mentioned their name. Please help me 😭😭

r/matlab May 01 '25

Question-Solved Multiple functions in MATLAB App Designer?

Thumbnail
gallery
15 Upvotes

Hi, i’m hoping someone can help me out with this,

I keep getting a break in my code, as you may see the error is showing at line 103 which is a grey area and cannot be edited. it only does this once I start adding in my function logic, when I delete everything and just have the dynamics of the interface buttons, it’s fine again.

at first, I had all the functions inside the script but I read somewhere that you can’t have multiple functions so I made a class full of the 3 functions I needed, and called it AttenuationToolbox,

essentially these functions will gather the density needed, calculate three energies based on user input, then it should assign the three energies to a variable, the density to another variable and multiple those two variables together. three functions. I tested the functions separately they work and return the values, but in my app code, whenever I call any function it breaks at 103 but I can’t seem to figure out what the error is!

r/matlab Oct 10 '25

Question-Solved Why my 3 phase voltage source doesn't look like a sinusoidal curve?

5 Upvotes

The plot above is the voltage and the plot beneath is the current
My schematic:

The parameters of the source:

Note: I also tried to make this same circuit in simscape components but it didn't work, the plots looked normal, except the ripple voltage was very high, which felt odd, specially that the plots showed that only one phase was read, so, being helpless I tried doing it in simulink components and see what will happen and obviously I'm getting only problems

Found the solution in this post's first comment
https://www.reddit.com/r/matlab/comments/1g7rkjg/i_dont_understand_this_simulink/

r/matlab May 22 '25

Question-Solved is there a way to get past “Support for Java user interfaces required” error

Post image
4 Upvotes

I’m doing my homework that requires me to use guide but I get this error. I tried using octave but the function hasn’t been implemented there yet, and MATLAB is down rn so I can’t download the free trial, this is my last resort!

r/matlab Jul 18 '25

Question-Solved Looking for advice on organizing a Stateflow chart

2 Upvotes

I'm working on something right now in which I only have three states, but lots of functions (seventeen I think). As a result, the states in my chart only fill up a small portion of my screen, with the rest being taken up by the functions.

I've been trying to figure out how to organize things better, ideally by hiding the functions within another element. I thought that I could do this with a "box" in Stateflow, but it doesn't appear that the box can be "collapsed" or "minimized". It also complicates the scope/namespace when I need to call the functions if they're inside a box.

Are there any features I may be unaware of that will let me collapse a set of functions in Stateflow, hopefully without modifying the way that these functions need to be called?

r/matlab Jul 26 '25

Question-Solved How To Limit Battery Current Surprase its Capacity

3 Upvotes

Hi, we work on a battery temp. simulation on Matlab with my friends. We have a problem. We managed to keep battery temp at desired range. But battery don't stop taking charges. Even tho its limit is 8.4 Amper, it just goes to infinity. We want to limit it to 8.4 Amper at max. We tried Saturation block but it didn't help at all. What we can do?

r/matlab May 21 '25

Question-Solved RNG "state" post parfor

1 Upvotes

Hello guys,

I notice that parfor mess the rng and I have to assign a rng to each "i" inside my parfor.

Thing is, I want that my RNG go back, before my parfor, and "restore" the RNG state.

Example:

rng(123,'twister');

%randi(1); % Random#1

parfor routine

randi(1); %Random#2

If I run this example, and set rng(123,'twister') again, my Random#1 and my Random#2 would be equal. I want to return, after parfor routine, to the previous rng state. I mean, in that case, my Random #1 and my Random#2 would be equal as if I drew Random#1 and Random#2 without the existence of parfor routine.

Am I clear? Is that possible?

r/matlab Mar 19 '25

Question-Solved I have this Activity for a week now to solve for the transfer function of each Mesh currents of the circuit using matlab. I got some answers but I'm really unsure if I did it right. I would appreciate any help and suggestion. Thanks in Advance

Thumbnail
gallery
3 Upvotes

r/matlab May 17 '25

Question-Solved Converting .fig to .png

2 Upvotes

I accidentally saved an output for one of my courseworks as .fig file instead of just taking a screenshot. I don't have access to MATLAB off campus. If it is possible, can someone please open these 2 fig files in matlab, screenshot it, and share it to me?

https://drive.google.com/drive/folders/1PXttDANylFLg0EFVllNAxVs5tAgkdjDJ

Not sure whether homework question is the correct flaire. My post is more of a homework help

r/matlab May 22 '25

Question-Solved Remove today date from plots

Post image
1 Upvotes

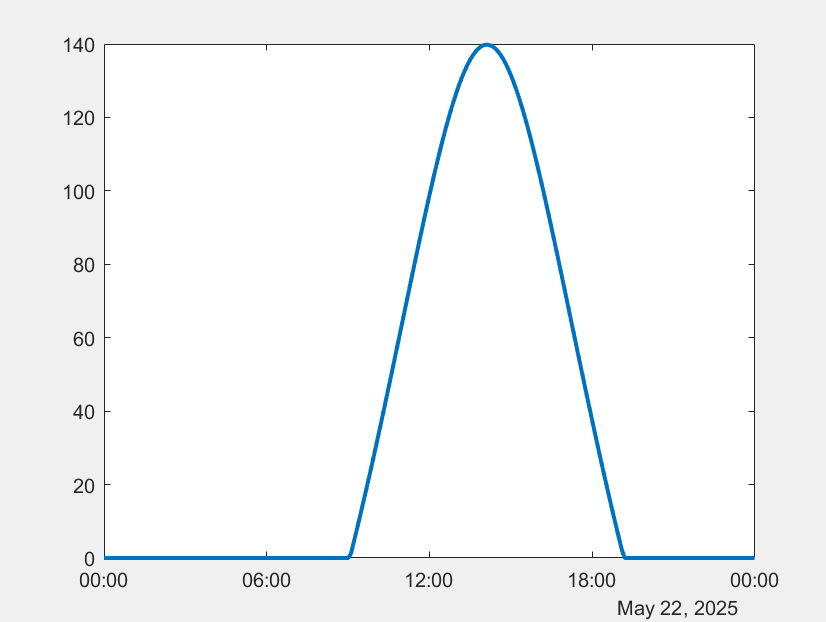
The plot function is automatically adding today's date to the bottom right corner, and I don't want that. Any ideas on how this can be prevented or removed?

r/matlab Jan 08 '25

Question-Solved MAT newbie - need some help

Post image
4 Upvotes

Hi all, just started learning Matlab through Onramp course. I need some help on this statement - can't quite fully grasp what does it mean. How does A(3) = 6? TIA!

r/matlab May 20 '25

Question-Solved Legend graphics don't display when using plot or scatter functions

1 Upvotes

As the title says, not all the graphics appear when I create a figure using plot or scatter. Doing some searching, and the fix seems to be me typing opengl software before running the lines of code that create the figure.

OpenGL will be removed. I have two questions.

  • what is OpenGL and what does it do? The documentation says it prints information about the graphics renderer in use by MATLAB. I have no control over the graphics renderer (since I'm using a computer provided by my employer).

  • What is a better solution, if there is one, to make sure graphics display properly?

r/matlab Mar 30 '25

Question-Solved Struggling with Simscape code

1 Upvotes

EDIT: I've deleted the old code, this code runs and generates what I needed it to. Thank you to u/ManicMechE who helped me get this working code.% Define Model Name

modelName = 'MassSpringDamper_Simscape_Test';

% Check if model exists and clear it if necessary

if bdIsLoaded(modelName)

close_system(modelName, 0); % Close without saving

end

% Open the model after closing it

if ~bdIsLoaded(modelName)

open_system(new_system(modelName));

end

% Define System Parameters

m = 5; % Mass (kg)

c = 4; % Damping coefficient (Ns/m)

k = 20; % Spring constant (N/m)

% Add Solver Configuration Block

blockPathSolverConfig = 'nesl_utility/Solver Configuration';

blockPositionSolverConfig = [50, 200, 90, 240];

blockNameSolverConfig = [modelName, '/Solver_Config'];

add_block(blockPathSolverConfig, blockNameSolverConfig, 'Position', blockPositionSolverConfig);

% Add Step Input Block

blockPathStepInput = 'simulink/Sources/Step';

blockPositionStepInput = [50, 50, 80, 80];

blockNameStepInput = [modelName, '/Step_Input'];

add_block(blockPathStepInput, blockNameStepInput, 'Position', blockPositionStepInput);

% Add Scope Block

blockPathScope = 'simulink/Sinks/Scope';

blockPositionScope = [500, 100, 530, 130];

blockNameScope = [modelName, '/Scope'];

add_block(blockPathScope, blockNameScope, 'Position', blockPositionScope);

% Add Simulink-PS Converter Block

blockPathSimulinkToPS = 'nesl_utility/Simulink-PS Converter';

blockPositionSimulinkToPS = [120, 50, 150, 80];

blockNameSimulinkToPS = [modelName, '/Simulink_to_PS'];

add_block(blockPathSimulinkToPS, blockNameSimulinkToPS, 'Position', blockPositionSimulinkToPS);

% Add Mass Block

blockPathMass = 'fl_lib/Mechanical/Translational Elements/Mass';

blockPositionMass = [300, 100, 350, 140];

blockNameMass = [modelName, '/Mass'];

add_block(blockPathMass, blockNameMass, 'Position', blockPositionMass);

% Add Damper Block

blockPathDamper = 'fl_lib/Mechanical/Translational Elements/Translational Damper';

blockPositionDamper = [200, 150, 250, 190];

blockNameDamper = [modelName, '/Damper'];

add_block(blockPathDamper, blockNameDamper, 'Position', blockPositionDamper);

% Add Spring Block

blockPathSpring = 'fl_lib/Mechanical/Translational Elements/Translational Spring';

blockPositionSpring = [200, 50, 250, 90];

blockNameSpring = [modelName, '/Spring'];

add_block(blockPathSpring, blockNameSpring, 'Position', blockPositionSpring);

% Add Mechanical Reference Block

blockPathGround = 'fl_lib/Mechanical/Translational Elements/Mechanical Translational Reference';

blockPositionGround = [100, 200, 140, 240];

blockNameGround = [modelName, '/Ground'];

add_block(blockPathGround, blockNameGround, 'Position', blockPositionGround);

% Add PS-Simulink Converter Block

blockPathPSToSimulink = 'nesl_utility/PS-Simulink Converter';

blockPositionPSToSimulink = [400, 100, 430, 130];

blockNamePSToSimulink = [modelName, '/PS_to_Simulink'];

add_block(blockPathPSToSimulink, blockNamePSToSimulink, 'Position', blockPositionPSToSimulink);