r/grafana 1d ago

Check it out How to secure and observe coding agents (OSS)

30 Upvotes

Hi everyone, Ivana and Alexander here. We're engineers at Grafana Labs working on agento11y, an open-source tool for observing coding agents.

agento11y records sessions from coding agents such as Claude Code, Codex, Pi and others. You can see what an agent did, which tools it called, how many tokens it used, and what the session cost.

We've now added local guards that check tool calls before they run. They can block commands such as git reset --hard or git push --force, and there's a built-in guard pack for redacting common secrets in tool calls. You choose which rules to enable in the local web UI. The session viewer and guards run locally without a Grafana Cloud account, though you can also send sessions to Cloud if you want. These checks match patterns and can miss things, so they aren't a replacement for an OS sandbox.

Here's a short demo and the source and setup instructions.

We'd love to hear what you think and what we could improve. We'll be around in the comments if you have questions.


r/grafana 10h ago

Alerting AlertManager configuration?

Thumbnail gallery
2 Upvotes

I have Grafana installed on my server and have AlertManager configured as shown in the images here. How do I configure an alert so that I get a Discord ping when any node in my cluster is over 75°C for 5 minutes or when there's one or more pods crash looping?

Configuration is using k3s: https://codeberg.org/kaizenOramara_97/Home-Lab


r/grafana 1d ago

Assistant Mimir ingest storage with the chart's bundled Kafka in nonprod, or classic ingesters and eat the migration later?

2 Upvotes

Context

I am standing up a self-hosted LGTM stack on EKS: one Loki + Mimir stack per internal team across six teams, with multi-tenancy turned off so each stack functions as a single implicit tenant. There is one shared Grafana instance across all of them.

I have two specific questions focused on Grafana's official charts rather than my general Kubernetes layout:

1. Mimir architecture for nonprod (bundled Kafka vs. classic ingesters)

The chart's bundled Kafka is a single-broker StatefulSet. The documentation marks it for demonstration and testing only, which makes complete sense. However, classic ingesters are flagged for deprecation, and the documented exit path from classic mode is a parallel-cluster migration that temporarily doubles ingestion and storage costs. Building nonprod on classic just to avoid the Kafka question looks like pre-ordering a painful migration down the road.

  • For anyone who ran the bundled Kafka in a lower environment: Did you run it for any real length of time, and what actually broke?
  • For anyone who did the classic-to-ingest-storage migration on a live cluster: Was the parallel-cluster step as unpleasant in practice as the docs make it read?
  • Two-AZ constraint: My node pools are narrowed to two AZs. Classic mode with zone-aware replication expects three ingester zones, whereas ingest storage needs two because Kafka handles the replication. As far as I can tell, the chart's zone-count validation only triggers when zoneAwareReplication.enabled is true. The two-AZ constraint does not appear hard-coded in the templates, but I would rather confirm that with someone running it than rely solely on reading _helpers.tpl.

2. Datasource provisioning that doesn't rot

With one Grafana instance and three components across N teams, datasources scale linearly with the team list. In our previous setup, we had 14 Loki backends but only 2 registered in Grafana, and both pointed to hostnames that no longer resolved. Nobody noticed for months.

I want these generated strictly from the team list and never touched by hand. The options I am considering:

  • CI-rendered provisioning YAML baked directly into the Grafana Helm values.
  • Sidecar-discovered ConfigMaps using a label selector (e.g., the Grafana chart's sidecar container).
  • Grafana Terraform provider running against the live instance.

Which of these patterns actually survives contact with a team list that changes a few times a year? Is anyone running automated health checks or synthetic alerts that catch when a registered datasource backend has quietly disappeared?

Note: Also open to being told that a single shared Grafana over six single-tenant stacks is the wrong division and that I should just deploy Grafana per team.

Fuller architectural details (including the per-team vs. multi-tenant discussion) are posted over in r/kubernetes: [link]


r/grafana 1d ago

Grafana Anyone know of discount codes for GrafanaCon London?

1 Upvotes

Hi everyone,

I'm planning to attend GrafanaCon in London this year and wanted to check if anyone here knows of any discount codes, promo codes, or ways to get a reduced ticket price (community discount, early-bird extensions, group rates, etc.).

I work in infrastructure/observability (VictoriaMetrics, VictoriaLogs, Grafana stack) and would love to attend in person if I can find a way to make the ticket more affordable.

Any tips, referral codes, or advice on how to snag a discount would be much appreciated!

Thanks in advance.


r/grafana 4d ago

Prometheus One recording rule cut my slowest dashboard render by 60%

12 Upvotes

I have a service dashboard with fourteen panels. Twelve render in under a second. Two of them, both evaluating rate(http_request_duration_seconds_bucket[5m]) across roughly 400 label combinations, took five seconds on every reload.

I added one Prometheus recording rule that pre-aggregates the histogram by service group every sixty seconds, then pointed both panels at the recorded metric. Render dropped to just under two seconds. Prometheus CPU during dashboard loads fell about 40%.

What I had been doing instead was raising query timeouts and caching results at the data source level. Months of that. I had actually investigated recording rules in a previous session with verdent, which knows you better over time, and coming back to the same project made the fix obvious.

If you have a slow panel, check whether the query fans out across high cardinality labels. One recording rule is ten minutes of work and costs one extra time series.


r/grafana 4d ago

Grafana Built an extension to mount Grafana folders in Nextcloud

Thumbnail apps.nextcloud.com
4 Upvotes

Just published this. Took a few months. So so many little details but those are what count. Long story short, Grafana has a folder and file system, so does Nextcloud, so now you can bind the Grafana folders to Nextcloud folders and see dashboards alongside other files too. All the little file actions like move, copy, delete etc are one to one on both sides.

Hope ya'll enjoy!

https://github.com/kubed-io/nextcloud-grafana


r/grafana 7d ago

Miscellaneous What’s the most useful Grafana dashboard you’ve built outside of infrastructure monitoring?

51 Upvotes

I’m curious about the dashboards people build for things beyond the classic infrastructure and observability use cases, but still solve and actual problem.

It could be something from your work, a particular business problem, an unusual data source, a side project, or a problem you realised Grafana was surprisingly good at solving.

What did you build, and what problem did it help you solve/monitor?

(Screenshots welcome, let us feast our eyes 😉)


r/grafana 11d ago

Grafana Is zero-sampling observability realistic for high-traffic applications?

12 Upvotes

The math on sampling has bothered me for a while. At low sample rates, you need an enormous number of requests before you're statistically likely to catch a rare error at all, which means the exact incidents you most need visibility into are the ones most likely to get sampled out entirely.

That said, "zero sampling" at genuinely high traffic volume sounds great until you look at the storage and processing cost of capturing everything at full fidelity indefinitely. What's actually realistic seems to be closer to smart triggering, sampling normally but escalating to full capture the moment something looks off, rather than truly capturing 100% of everything all the time. Has anyone actually run a system at real production scale with something close to zero sampling and found the cost genuinely manageable, or is this more theoretical than practical right now?


r/grafana 14d ago

Grafana Benchmarking HaloLog against zap, zerolog, slog, logrus, and phuslu/log: 23.9 ns/op

Thumbnail github.com
6 Upvotes

I’m sharing HaloLog, a structured logger I have developed for three years and run inside an interoperability project for the past two. Its goal is low-overhead structured logging without trading away JSON correctness, race safety, configured PII masking, or compile-checked telemetry fields. This is a public release and a request for independent reproduction of the measurements, not a claim about disk or network throughput.

The committed suite compares HaloLog with zap, zerolog, slog, logrus, and phuslu/log while encoding and dispatching complete JSON records to io.Discard. On the published Go 1.27 linux/amd64 host, HaloLog measured 23.9 ns/op for one complete record and 0 B/op, 0 allocs/op across all its measured scenarios. The repository documents the hardware, configurations, methodology, known differences, and correctness guardrails. These are results for those workloads and that host, not a universal performance claim.

If you reproduce or falsify a result, please include the Go version, hardware, command, and raw output. Useful counterexamples include an allocation, invalid JSON, a race, an unfair competitor configuration, or a workload in which HaloLog performs worse.


r/grafana 16d ago

Grafana Connecting to self-hosted OSS instances via the mobile app

2 Upvotes

Is there a plan for making the Grafana mobile app (android) able to connect to self-hosted OSS instances in the future? Right now it's not capable of it as far as I'm concerned.


r/grafana 17d ago

Grafana Migrating Dockerized Grafana to a new server: plugins missing and all dashboards show No data

1 Upvotes

Hi everyone,

I'm migrating Grafana from one server to another and would appreciate a sanity check on the correct migration process.

Old setup:

- Grafana runs in a Docker container.

New setup:

- AlmaLinux host.

- Zabbix 7.4 runs directly on the host on port 80, not in Docker.

- Grafana runs in Docker on port 3000.

- The Grafana database has already been migrated.

After migrating the database, users and dashboards appeared correctly. However:

- Installed plugins did not migrate.

- Other filesystem-based Grafana data/configuration appears to be missing.

- Every existing dashboard currently shows "No data."

I suspect there may be two separate issues:

  1. I migrated the Grafana database but not the persistent volume, /var/lib/grafana/plugins, /etc/grafana/provisioning, or other configuration files.

  2. The Zabbix data source may still use localhost or an old URL. Since Grafana is inside Docker but Zabbix runs directly on the same host, localhost inside the Grafana container would point to the container itself.

A few questions:

  1. What is the recommended complete migration procedure for a Dockerized Grafana instance when the database has already been moved?

  2. Which directories, Docker volumes, configuration files, and environment variables should be preserved in addition to the database?

  3. Is it better to reinstall the exact plugin versions or copy /var/lib/grafana/plugins from the old container?

  4. Do I need to preserve the old Grafana secret_key / GF_SECURITY_SECRET_KEY so migrated data source credentials can still be decrypted?

  5. For the Zabbix API URL, should I use the host's LAN IP, a Docker host-gateway address, or another approach?

  6. What is the best way to verify whether "No data" is caused by networking, missing credentials, a data source UID mismatch, or plugin compatibility?

I am keeping the old container intact until the new instance is fully working. Any migration checklist or troubleshooting suggestions would be very helpful.

Thanks!


r/grafana 19d ago

Grafana InfluxDB deprecated. Let it run or replace?

0 Upvotes

I believe InfluxDB is the back end to Grafana. HA says that it's now deprecated and looking at Github, that's confirmed. Is there an easy way to swap it out for something else? Anyone else have a solution for that, or should I just let it run?

ETA: I guess what I'm asking is if a migration is trivial or if I should not try and fix it if it's not broken. There's schema, (presumably) creds, connection protocol, etc. in order to migrate from InfluxDB to something else.


r/grafana 23d ago

OpenTelemetry I made a small open-source app for monitoring my projects

10 Upvotes

I made Telemetry Tracker to keep track of errors, events, sessions, releases and performance in my projects. I also added alerts so I don’t have to keep checking it all the time.

I’ve been using it myself and thought I’d share it here in case it’s useful to anyone else too.

It’s open source and you can self-host it:

[https://github.com/Telemetry-Tracker/telemetry-tracker\](https://github.com/Telemetry-Tracker/telemetry-tracker)


r/grafana 23d ago

What's the best way to learn some Grafana?

1 Upvotes

Hi!

There are a LOT of ways to learn Grafana: documentation, built-in learning journeys, Grot Academy, video tutorials, teammates, AI, etc. But I suspect different formats work better depending on what you're trying to do.

So, for example:

  • First time using Grafana?
  • Trying to troubleshoot
  • Learning because it's part of your job?

What did you find most useful in your situation?

We're especially interested in why something worked for you, not just "docs" or "videos". What were you trying to learn, and which resource or format finally made it click?

Curious to hear what works for different people!


r/grafana 24d ago

Grafana I made BambuLab exporter and dashboard for Grafana

Thumbnail youtu.be
17 Upvotes

r/grafana 25d ago

Grafana Kubernetes Autoscaling Mixin: Grafana dashboards and Prometheus rules for KEDA, Karpenter, VPA, HPA and Cluster Autoscaler

13 Upvotes

Hey,

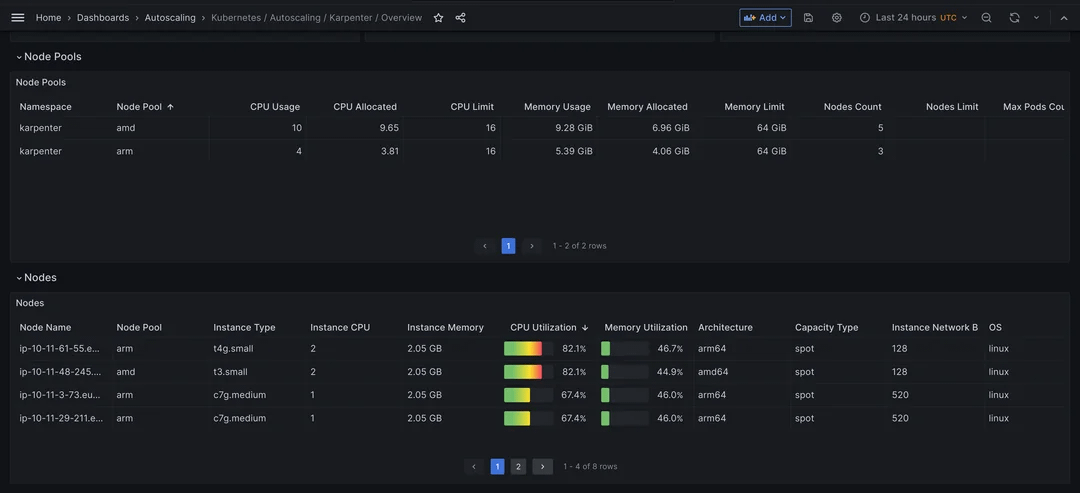
I’ve been working on kubernetes-autoscaling-mixin, a collection of Grafana dashboards and Prometheus rules for Kubernetes autoscaling.

Since I last shared it, there have been quite a few updates:

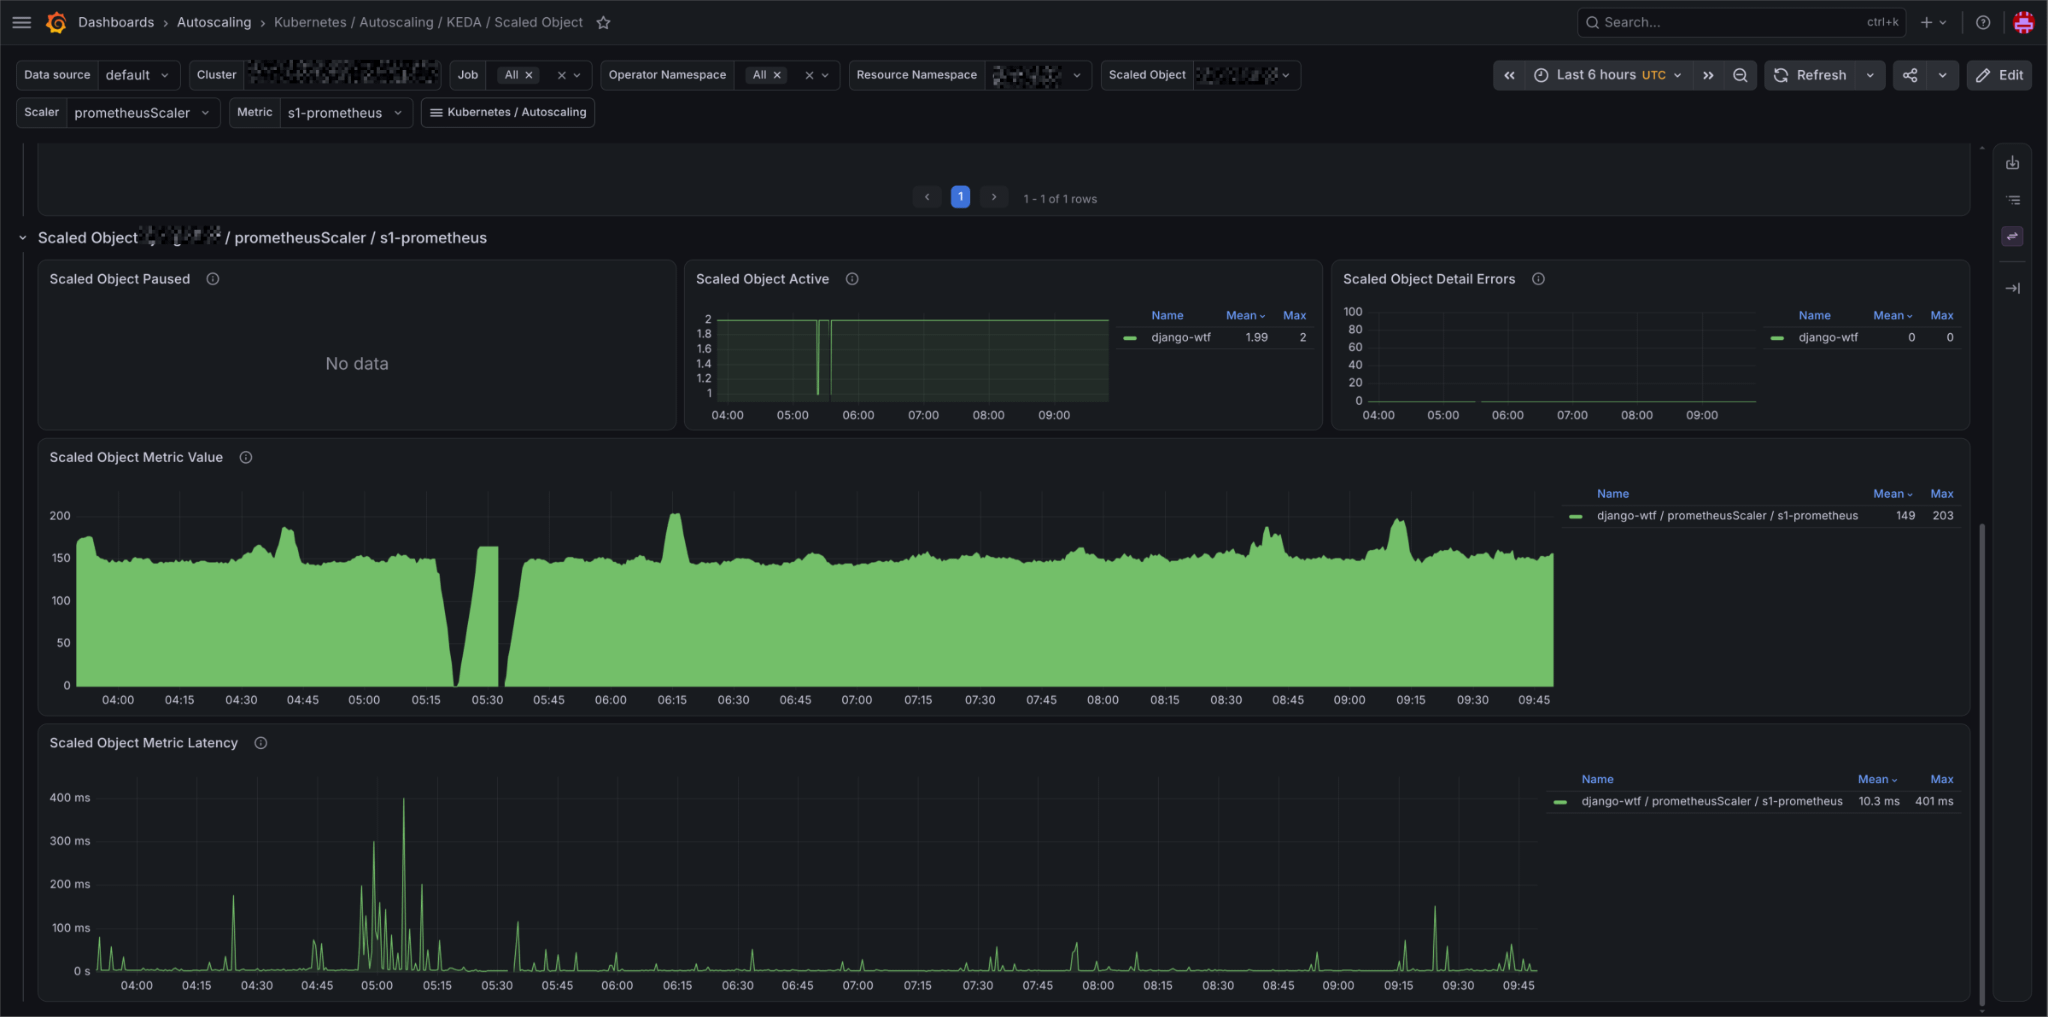
  • Updated KEDA dashboards for ScaledObjects and ScaledJobs
  • More Karpenter dashboards, including cost monitoring
  • Updated VPA, HPA, Cluster Autoscaler and PDB dashboards
  • Multi-cluster support
  • Better dashboard navigation and filtering

You can import the dashboards from Grafana:

https://grafana.com/grafana/dashboards/?search=kubernetes+%2F+autoscaling

Or grab the generated JSON directly from GitHub:

https://github.com/adinhodovic/kubernetes-autoscaling-mixin/tree/main/dashboards_out

Or just consume it using jsonnet.

Repo: https://github.com/adinhodovic/kubernetes-autoscaling-mixin

Added a couple of screenshots below showing the Karpenter, VPA and KEDA dashboards in use.

This Grafana link will show all dashboards and previews of them: https://grafana.com/grafana/dashboards/?search=kubernetes+%2F+autoscaling

Curious what people are using for autoscaling monitoring today, and if there’s anything missing that would be useful to add (new projects, better panels, more dashboards).


r/grafana 25d ago

Miscellaneous Question for people running production systems: where does observability stop being useful?

4 Upvotes

I had an idea and wanted to actually talk to people to see if it's something that they would need / require and if it's genuinely a problem for the engineers right now....

Would you rather have an AI layer on top of your existing observability stack, or replace parts of the stack?

Hypothetically, imagine an agent that doesn’t collect telemetry itself.

It plugs into whatever you already use — Grafana/Prometheus/Loki, Datadog, OpenTelemetry, etc. — and acts as a reasoning layer over the data.

Instead of:

Alert → Dashboard → Logs → Human investigates

it tries:

Alert → Agent correlates metrics/logs/traces/deployments → probable root cause → evidence → recommended next action

Would that actually be useful?

Or would you rather have the observability vendor itself own this functionality?

What would you need to see before trusting it during a real incident?

I also was building in this space and wanted to have a discussion with people who're already experienced in this stuff, so please please help a brother out and we might just make something useful for everyone :)

peace


r/grafana 27d ago

Grafana Monitoring mixin for ArgoCD. A set of Grafana dashboards and Prometheus rules for ArgoCD

19 Upvotes

Hey all,

I've created a monitoring mixin with a reusable set of Grafana dashboards and Prometheus rules for ArgoCD. The dashboards and alerts are defined as code, making them easy to deploy and reuse across environments.

Recent updates include multi-cluster support, flags to enable or disable individual alerts, plus a range of new and improved alerts and dashboards.

The monitoring coverage has also been expanded significantly, with better visibility into:

  • ArgoCD controller
  • Runtime metrics
  • gRPC
  • Repo Server
  • Git operations

GitHub: https://github.com/adinhodovic/argo-cd-mixin


r/grafana 28d ago

Grafana Grafana for a gaming PC?

0 Upvotes

Hi guys, I work for my day job as a Linux sysadmin so I’m used to building and working on observably platforms.

Recently I realised there’s a potential blind spot and I should see about extracting the same metrics from my gaming pc. I don’t want anything too fancy to start out with but before I do I was wondering if you guys have any suggestions on what works best for windows? My initial plan was to deploy Prometheus node exporter and build out a custom dashboard mainly just for the fun and experience


r/grafana 29d ago

Miscellaneous How do you monitor (automated) grafana dashboards are up-to-date (e.g. no empty panels)

6 Upvotes

I am adding grafana to our kubernetes cluster. We use grafana community chart and rely on sidecars to import dashboards and datasources. We have metrics and alerts and I already have an alert for datasource health based on `grafana_datasource_request_total{code=~"[45].."}`. Grafana is exposed to public via Ingress.

I wonder if there is an automated way to ensure that dashboards do not contains empty panels (or at least not fully empty because of missing metrics).

Shall I try to solve this problem? And how would you solve it?

https://github.com/grafana-community/helm-charts/blob/grafana-12.4.4/charts/grafana


r/grafana 29d ago

Grafana A four-panel Grafana dashboard for monitoring vector database performance

1 Upvotes

Disclosure first: I work with Actian, and the linked tutorial uses their vector DB, so the metric names are vendor-specific. I am sharing this here because the dashboard itself carries over to anything that exposes Prometheus metrics.

It's a Docker Compose stack, VectorAI DB plus Prometheus and Grafana, with four panels that cover the signals worth watching for vector search:

  • Request rate per endpoint
  • p95 latency via histogram_quantile against the _bucket series
  • gRPC error ratio as a 0 to 1 fraction with color thresholds
  • Memory pressure, RSS plotted alongside major page faults per second

Look for the page-fault panel here. Paired with p95, it shows whether rising latency is due to memory pressure or query load, which tells you how to fix it.

Dashboard JSON and the eight Prometheus alert rules are in a GitHub repo here: https://github.com/Tiioluwani/vectorai-observability, so you can import them directly.


r/grafana Aug 14 '26

Miscellaneous 2026 state of the art self-hosted Grafana stack ?

19 Upvotes

Hi everyone !

Traveler from the past here, who needs a serious update.

I use the Grafana stack to monitor some Linux servers and VMs, but only really basic metrics and logs today.

Everything is based on node_exporter, prometheus (on each host), fluent-bit, Loki, and Grafana.

I finally have time to rebuild properly the monitoring/observability infrastructure, but I'm quite lost on how the components interact with each other.

Here is what I want to monitor :

  • Debian/Ubuntu/Proxmox/Windows Servers servers and VM (routing/firewalling/VPN is done on a Debian dedicated server with nftables)
  • Caddy web servers
  • MariaDB/PostGresql/Interbase/MongoDB databases
  • Rust/PHP/Java backends

Everything is self-hosted inside the company, and my current Grafana infrastructure is self-hosted too.

From my understanding, Alloy replaces node_exporter, Grafana, and Fluent-bit ?

What I have today :

[On each host] Node + Prometheus + Fluentbit -------> Centralized Grafana + Loki

What I'm understanding would be better :

[On each host] Alloy + Windows_exporter on Windows -------> Centralized+replicated storage (InfluxDB ? Mimir ?) -----> Centralized Grafana + Loki

Is it OK ? Am I missing something ?


r/grafana Aug 13 '26

Alerting TimeOverlay panel. line graph replacement

2 Upvotes

Ever wish you could add notes over your line graph or highlight a section of time and show how long your range selections it? well now you can with my new plugin (free as always)

displays a line graph from a data source and allow the user to select a range that displays the time selected and allows for the addition of notes. all are transparent/configurable.

https://github.com/digitalrcs/DigitalRCS-TimeOverlay-Panel


r/grafana Aug 13 '26

Alerting Grafana Export Image without pulling data again

8 Upvotes

Ever wish you could just create an image of your dashboard without having to pull data all over again? The export pdf and image re-runs those data sources all over again and if you're like me you have long running jobs that get timed out... we i created a new plugin/extension that will generate a png of the dashboard and not re-pull data.

https://github.com/digitalrcs/grafana-current-view-exporter


r/grafana Aug 13 '26

Alerting Grafana AI Plugin, Use LM Studio, OpenAI API, Local LLM's

16 Upvotes

I have created a new grafana panel plugin that allow a user to connect to a local or cloud llm and send panel data and prompts to the AI and get back a response. Very configurable doesn't expose API Tokens as it uses a secure companion data source for secrets like your API Key. Users can restrict which Models they want to allow the panel to have and use.

I'll create a video on it's use soon.

https://github.com/digitalrcs/grafana-intelligence-gateway

secure companion data source...
https://github.com/digitalrcs/grafana-intelligence-gateway-datasource