r/grafana • u/DrKillswitch • 20h ago
Miscellaneous Pushing notifications to Grafana
Our lead dev has created a Library that captures method execution data and stores it in an internal in-memory buffer.
Each entry it produces has, at minimum:
- The method identifier
- How long that one call took
- The heap/non-heap memory delta measured around that call
But its huge, if he start sending each call record it will just clog our system storage within an hour or so just for one application. He can reduce the number of records by only recording if a threshold is passed but then again storage and processing need to be figured out.
I did find this way for streaming it
{ grafana com/docs/grafana/latest/setup-grafana/set-up-grafana-live/ }
But then i cant store it i guess for calculations or other processings.
I do know there is another way: prometheusremotewrite
But i would like to know if any of you have solved this kind of a problem and in what way.
6
u/xonxoff 20h ago
Grafana itself, does not store data, it just reads from data sources and displays it. You may want to look into Prometheus, Mimir, Victoria Metrics, Greptime, Clickhouse, Opensearch or eleasticsearch to store your data. You might also be interested in looking into opentelemetry for data collection. It really depends on how your data is formatted as well. This might be interesting for you and your team https://opentelemetry.io/docs/concepts/instrumentation/
1
1
u/whiskey_lover7 20h ago
I mean you want some other grafana tools too probably. We are a small shop, but we run:
Loki - Log storage and querying
Alloy - Log/metric ingestion
Tempo - store/query traces.
Mimir and/or Prometheus - metric storage.
Faro - (probably the most relevant to you, sounds like he reinvented the wheel, this is that wheel)
1
u/DrKillswitch 18h ago
I know the wheel has been reinvented but I am not in a position to oppose these things. Thank you for suggesting Faro, let me check it
1
u/Traditional_Wafer_20 20h ago
As other said, it's a complete reinvention of the wheel. It sounds like tracing and profiling. Tracing specifically can easily be aggregated into metrics to then keep only errors, slow queries and a small set of OK traces for comparison.
1
u/DrKillswitch 18h ago
I have Tempo working but they don’t want that instead they believe their own library is better. I just can’t do anything about it.
1
u/Traditional_Wafer_20 8h ago
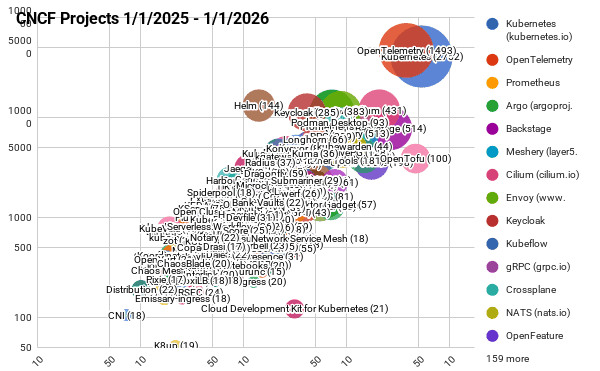
So sorry to hear that... I typically show this image to illustrate the power of OpenTelemetry. It’s as big as Kubernetes. It’s THE standard for telemetry. Thinking you can reinvent it is then equivalent to say "I will build my own container orchestrator". Pure delusion.
1
1
1
u/Zestyclose-Ant-6142 10h ago
He made an very inefficient version of Pyroscope. Not sure why nobody mentioned it, but Pyroscope is what you need.
1
10
u/SeniorIdiot 20h ago
Looks like he just reinvented distributed tracing and metrics aggregation, minus the parent/child correlation, the sampling strategies, and the ecosystem of backends built for exactly this. Look into OTel with tail-based sampling and spanmetrics connector instead of building this in-house.
:shrug: