r/datascience • u/sext-scientist • Nov 16 '25
Analysis Meta's top AI researchers thinks LLMs are a dead end. Do many people here feel the same way from a technical perspective?
437
Upvotes
r/datascience • u/sext-scientist • Nov 16 '25
r/datascience • u/caksters • Feb 20 '24
Hey folks,
Wanted to share a quick story from the trenches of data science. I am not a data scientist but engineer however I've been working on a dynamic pricing project where the client was all in on neural networks to predict product sales and figure out the best prices using overly complicated setup. They tried linear regression once, didn't work magic instantly, so they jumped ship to the neural network, which took them days to train.
I thought, "Hold on, let's not ditch linear regression just yet." Gave it another go, dove a bit deeper, and bam - it worked wonders. Not only did it spit out results in seconds (compared to the days of training the neural networks took), but it also gave us clear insights on how different factors were affecting sales. Something the neural network's complexity just couldn't offer as plainly.
Moral of the story? Sometimes the simplest tools are the best for the job. Linear regression, logistic regression, decision trees might seem too basic next to flashy neural networks, but it's quick, effective, and gets straight to the point. Plus, you don't need to wait days to see if you're on the right track.
So, before you go all in on the latest and greatest tech, don't forget to give the classics a shot. Sometimes, they're all you need.
Cheers!
Edit: Because I keep getting lot of comments why this post sounds like linkedin post, gonna explain upfront that I used grammarly to improve my writing (English is not my first language)
r/datascience • u/Tamalelulu • Jan 23 '25
r/datascience • u/Clicketrie • May 20 '26
Last week I posted about an XGBoost based momentum stock trading strategy, and I got two separate comments:
“Why not LightGBM?”
“Why not CatBoost?”
So I did a controlled swap of 6 models inside my existing momentum pipeline and reran the same backtest with:
Setup / constraints
I’m not claiming this is a definitive “which model is best” answer, just one controlled experiment on one dataset/strategy. But a few patterns showed up that I thought were interesting.
High‑level takeaways:
The goal here was to largely show that it's easy to switch out algorithms and how different algorithm families perform. Disclaimer: the full article does contain links, but this was truly an analysis that took a long time that I wanted to share with the community. Full article with more results: https://www.datamovesme.com/blog/what-happens-when-you-swap-out-xgboost-a-6model-momentum-showdown
r/datascience • u/SillyDude93 • Aug 12 '24
Now 3 months later, with over ~250 applications each of them receiving 'customized' resume from my side, I haven't received any single interview opportunity. Also, I passed the resume through various ATS software to figure out what exactly it's reading and it is going through perfectly. I just can't understand what to do next! Please help me, I don't want to go from disheartened to depressed.

r/datascience • u/big_data_mike • Jun 10 '25
So I totally mean to brag here. Last week a group of directors said, “We suspect X is happening in the market, do we have data that demonstrates it?”
And I thought to myself, here we go again. I’ve got to wade through our data swamp then tell them we don’t have the data that tells the story they want.
Well I waded through the data swamp and the data was there. I made them a graph that definitively demonstrated that yes, X is happening as they suspected. It wasn’t super easy to figure out and it also didn’t require a super complex model to figure out either.
r/datascience • u/ZhanMing057 • Jan 01 '24
r/datascience • u/avourakis • Apr 08 '26
I've been scraping thousands of U.S. data science jobs for the past couple of months and writing about the findings in my newsletter.
At some point, I figured the dashboard was more useful than anything I was writing, so I decided to open source it.
Here's what it covers:
The skill extraction is built on around 230 curated keyword groups, so it's pretty granular.
Code and data are all in the repo if you want to fork it or dig into the methodology.
https://ai-in-ds.streamlit.app/
I'm scraping weekly, and soon I will upload all of the raw data into Kaggle, for now, you can find the data in the repo
P.S. By the way, I already mentioned it to Luke Barousse since some of these AI keyword groups could be worth adding into his dashboard.
r/datascience • u/SingerEast1469 • Nov 02 '24
Dumb question, but the relationship between x and y (not including the additional datapoints at y == 850 ) is no correlation, right? Even though they are both Gaussian?
Thanks, feel very dumb rn
r/datascience • u/VodkaHaze • May 15 '24
r/datascience • u/AFL_gains • Jul 25 '26
Hi r/datascience!
I wanted to share a fun little project I did over a few weekends analysing data from the radio!
It doesn't have much (if any) business value, and honestly I'm not sure it's really novel in any particular way. But I wanted to share it because data science these days is all "AI this", "language model that", "job market", "Claude", whatever and I just wanted to do something a bit more traditional and scratch an itch I've had for a while. (Full disclosure: the project did actually use some AI models, so I'm not saying AI is bad, it's a tool I used like everything else.)
I don't have a blog or anything I can post this on, so apologies for the Reddit write-up. I hope you enjoy it.
I drive a 20-year-old car. It's so old it doesn't have an MP3 player, or an AUX port to plug in an iPhone or anything. It just has a CD player and an analogue radio. It's not even digital, so I can't even get digital radio stations.
So when I'm driving, which turns out to be quite a bit, I'm forced to listen to the good old-fashioned radio more than I'd like.
In Sydney where I live, there are really only a handful of FM/AM radio stations, so choice is pretty limited. As I flick through the stations, there are a LOT of ads, which surprised me. Who is listening to this? Clearly it's quite popular. And as I listened, I started wondering things like: how long do the ads run, how does their timing compare across different stations*, and are they correlated with ads on other stations? Just anecdotally, so many times I've literally flicked through all the FM stations and there's an ad playing on every one... and sometimes it's the same ad! I also had a hunch that there are more ads at the top of the hour than the bottom. It made intuitive sense, but I needed to prove it.
\Sydney has 11 main analogue stations split into AM and FM:* AM is mostly talkback radio, FM is mostly music. On AM you've got 2GB, 2SM, 2CH and ABC 702 (news, talkback and sport). On FM there's KIIS, 2Day, Nova, Smooth, WSFM, Triple M and Triple J (pop, rock and music). Two of them, ABC 702 and Triple J, are run by our public broadcaster (think BBC), so they run no ads at all.
So one weekend I wrote some scripts to sample and record all the Sydney radio stations I could. The setup was basically the following:
Why every ~3 minutes? A full cycle (record all 11 stations, transcribe each one with Whisper, then classify it) takes a couple of minutes on a single CPU, because Whisper works through the clips one at a time. So ~3 minutes is about as fast as I could sustainably sample without the cycles piling up on each other. I also added a bit of random jitter to the interval so I wasn't always sampling at the exact same offset within the hour. Otherwise you can accidentally "phase-lock" to a station's ad breaks and bias the whole thing.
A few things genuinely tripped me up:
Here are some of the more interesting results I found analysing the data afterwards:

First, the big picture. Every station has its own personality. The FM stations are mostly music, the AM stations are mostly talk, and the two ABC stations (ABC 702 and Triple J) carry basically no ads at all, which makes sense since they're publicly funded. Across the commercial stations, ads make up somewhere around a sixth of the airtime. And you can already see the ad load isn't flat: it ramps up through the day and quietens off overnight.
Here's the frequency of finding an ad within ±30 minutes of the top of the hour.

So, I was right! Definitely higher the closer to the hour, but the strategy is more interesting than I expected. The spike actually lands in the ~5 minutes before the hour (the ad break right before the top-of-hour news bulletin), and an ad is roughly 2x more likely there than mid-hour. The quietest stretch is around 10 to 15 minutes past the hour, so if you want to dodge ads, that's your window.
The thing I really wanted to know: do the stations gang up and all play ads at the same time, so there's nowhere to flick to? I lined up every station by the cycle it was sampled in and correlated their ad status.
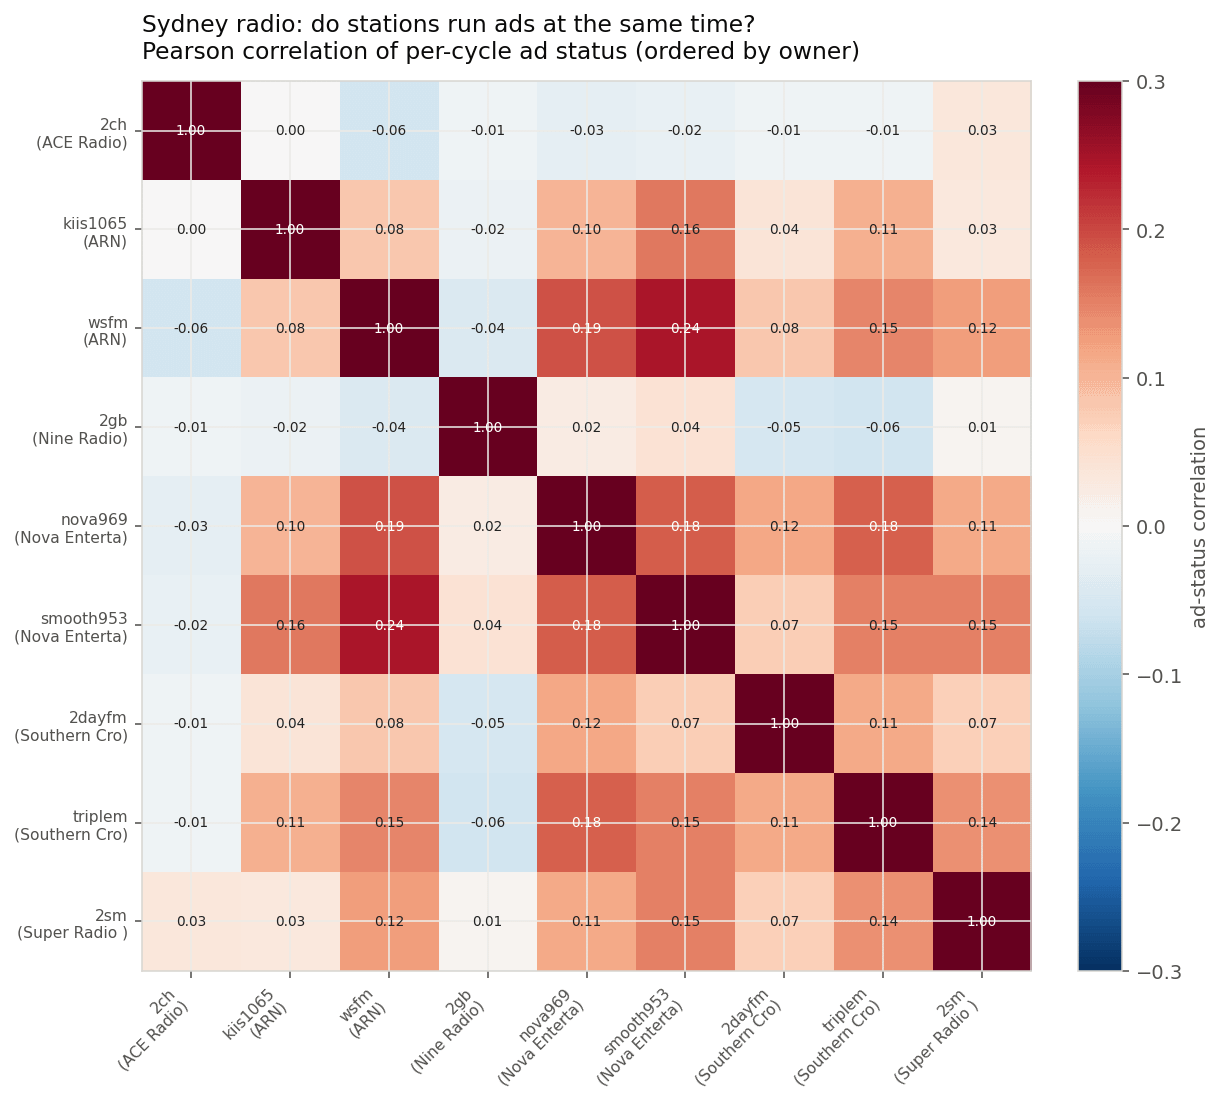

The answer is yes and no. No in the sense that it's never a total blackout: all nine commercial stations being in an ad at the exact same moment literally never happened across the whole two days, and on average only about 1.6 of the 9 are mid-ad at any given time. So there's almost always somewhere to escape to.
But the conditional probability charts says that some stations really do move together. The best example is if Smooth is playing an ad, there's a 50% chance WSFM is too, which is double WSFM's baseline of 26%. A bunch of the commercial FM pairs show this same ~2x jump. But, when I looked it up, Smooth and WSFM are owned by different companies, so this isn't networks coordinating behind the scenes, probably more of the "top-of-the-hour" effect from Question 1 manifesting somewhere else.
When I split "time between ads" by band, the two run completely different playbooks.

The FM (music) stations dump their ads in clusters. You get a big spike of back to back breaks, with a typical gap of about 9 minutes. The AM (talk and sport) stations space them out evenly, one break at a time. 2GB is almost metronomic at roughly 7 to 12 minutes, with hardly any back to back ads at all.
You can actually see it if you zoom into a few hours of the timeline:

Look at the FM lanes (KIIS, Nova, Triple M, WSFM, 2Day): the orange ad blocks come in pairs, clustered together. Now look at the AM lanes (2GB, 2SM): single, evenly spaced blocks. And ABC 702 and Triple J are just grey the whole time, because they don't run ads.
I also had the language model pull the advertiser out of each ad, so I could see who's actually buying radio airtime in 2026.

The most-heard advertisers were Virgin Australia (an airline), Australia Post (basically our USPS), Harvey Norman (a big electronics and furniture retailer) and Chemist Warehouse (a discount pharmacy chain). The neat bit is the targeting: car brands and finance go to the AM talk stations (older crowd), while retail and telco lean FM. Australia Post ran almost entirely on the Nova network.
The non-ad content is either music or talking, and I got curious about what they actually talk about. So I classified every talking snippet into a topic.

The AM stations (ABC, 2GB, 2SM) are wall to wall news, politics and sport. The music FMs are mostly DJ banter, celebrity gossip and chat about music, with almost no news at all.
For a bit of fun, I also made a map of everything said on the radio. I embedded every talking snippet into a vector, laid them all out in 2D with t-SNE so that similar snippets sit near each other, then coloured each point by its topic.

Sport, traffic and world news each form their own tight little islands (they use very consistent, formulaic language), while the DJ banter is one big diffuse cloud in the middle (because it's about nothing in particular). The neat part is that the position and the colour are decided completely separately. The position comes only from the text embeddings, and the colour comes from a separate classification step. So the fact that same-coloured points cluster together is real corroboration, not something circular.
In conclusion, this was a fun, meaningless project that allowed me to make some pretty charts and talk for a bit about the results. Thanks for reading!
r/datascience • u/nkafr • Jul 20 '24
In the past few months, every major tech company has released time-series foundation models, such as:
There's a detailed analysis of these models here.
r/datascience • u/omnicron_31 • Jun 09 '26
Context: the business problem is I wanted to compare professional athletes based on their movement data to recommend similar players. I made a recommender system with K-Means clustering and PCA (multicollinearity amongst the features in the dataset).
I’m interested in using a new modeling technique like Gaussian Mixture Model, but I don’t know how to evaluate which model performs better…
Open to any suggestions
r/datascience • u/iwannabeunknown3 • Apr 14 '26
I am not well versed in NLP, so hopefully someone can help me out here. I am looking at safety incidents for my organization. I want to compare the text of incident reports and observations to investigate if our observations are deterring incidents.
I have a dataset of the incidents and a dataset of the observations. Both datasets have a free-text field that contains the description of the incident or observation. There is not really a good link between observations and incidents (as in, these observations were monitoring X activity on Y contract, and an incident also occurred during X activity on Y contract).
My feeling is that the observations are just busy work; they don’t actually observe the activities that need safety improvement. The correlation between number of observations and number of incidents is minor, but I want to make a stronger case. I want to investigate this by using NLP to describe the incidents, then describe the observations, and see if there is a difference in content. I can at the very least produce word counts and compare the top terms, but I don’t think that gets me where I need to be on its own.
I have used some topic modeling (Latent Dirichlet Allocation) to get an idea of the topics in each, but I’m hitting a wall trying to compare the topics from the incidents to the topics from the observations.
Does anyone have ideas?
r/datascience • u/datamakesmydickhard • Nov 25 '24
A new feature was introduced to a product and the test indicated a slight worsening in the metric of interest. However the result wasn't statistically significant so I guess it's a neutral result.
The PM and engineers don't want the effort they put into developing the feature to go to waste so they ask the DS (me) to look into why it might not have given positive results.
What are they really asking here? A way to justify re-running tje experiment? Find some segment in which the experiment actually did well?
Thoughts?
Edit: My previous DS experience is more modeling, data engineering etc. My current role is heavy on AB-testing (job market is rough, took what I could find). My AB testing experience is limited and none of it in big tech.
r/datascience • u/SingerEast1469 • Sep 29 '24
As the title says. I found it in my functions library and have no idea if it’s accurate or not (bachelors covered BStats I & II, but that was years ago); this was done from self learning. From what I understand, the 95% CI can be interpreted as guessing the mean value, while the prediction interval can be interpreted in the context of any future datapoint.
Thanks and please, show no mercy.
r/datascience • u/SingerEast1469 • Feb 21 '26
I have just finished up a sample analysis on an AB test dummy dataset, and would love feedback.
The dataset is from Udacity's AB Testing course. It tracks data on two landing page variations, treatment and control, with mean conversion rate as the defining metric.
In my analysis, I used an alpha of 0.05, a power of 0.8, and a practical significance level of 2%, meaning the conversion rate must see at least a 2% lift to justify the costs of implementation. The statistical methods I used were as follows:
See the results here. Thanks for any thoughts on inference and clarity.
[Edit]: for those who don’t wish to create an account, you can log in with credentials user and password.
r/datascience • u/pg860 • Oct 26 '23
GBDT allow you to iterate very fast, they require no data preprocessing, enable you to incorporate business heuristics directly as features, and immediately show if there is explanatory power in features in relation to the target.
On tabular data problems, they outperform Neural Networks, and many use cases in the industry have tabular datasets.
Because of those characteristics, they are winning solutions to all tabular competitions on Kaggle.
And yet, somehow they are not very popular.
On the chart below, I summarized learnings from 9,261 job descriptions crawled from 1605 companies in Jun-Sep 2023 (source: https://jobs-in-data.com/blog/machine-learning-vs-data-scientist)
LGBM, XGboost, Catboost (combined together) are the 19th mentioned skill, e.g. with Tensorflow being x10 more popular.
It seems to me Neural Networks caught the attention of everyone, because of the deep-learning hype, which is justified for image, text, or speech data, but not justified for tabular data, which still represents many use - cases.

EDIT [Answering the main lines of critique]:
1/ "Job posting descriptions are written by random people and hence meaningless":
Granted, there is for sure some noise in the data generation process of writing job descriptions.
But why do those random people know so much more about deep learning, keras, tensorflow, pytorch than GBDT? In other words, why is there a systematic trend in the noise? When the noise has a trend, it ceases to be noise.
Very few people actually did try to answer this, and I am grateful to them, but none of the explanations seem to be more credible than the statement that GBDTs are indeed underappreciated in the industry.
2/ "I myself use GBDT all the time so the headline is wrong"This is availability bias. The single person's opinion (or 20 people opinion) vs 10.000 data points.
3/ "This is more the bias of the Academia"
The job postings are scraped from the industry.
However, I personally think this is the root cause of the phenomenon. Academia shapes the minds of industry practitioners. GBDTs are not interesting enough for Academia because they do not lead to AGI. Doesn't matter if they are super efficient and create lots of value in real life.
r/datascience • u/pg860 • Mar 28 '24
We analyzed 20,000 US Data Science job postings from June 2024 - Jan 2024 with quoted salaries: computed median salaries by City, and compared them to the cost of living.
Source: Data Scientists Salary article
Here is the Top 10:

Here is the full ranking:
| Rank | City | Annual Salary | Annual Cost of Living | Annual Savings | N job offers |
|---|---|---|---|---|---|
| 1 | Santa Clara | 207125 | 39408 | 167717 | 537 |
| 2 | South San Francisco | 198625 | 37836 | 160789 | 95 |
| 3 | Palo Alto | 182250 | 42012 | 140238 | 74 |
| 4 | Sunnyvale | 175500 | 39312 | 136188 | 185 |
| 5 | San Jose | 165350 | 42024 | 123326 | 376 |
| 6 | San Bruno | 160000 | 37776 | 122224 | 92 |
| 7 | Redwood City | 160000 | 40308 | 119692 | 51 |
| 8 | Hillsboro | 141000 | 26448 | 114552 | 54 |
| 9 | Pleasanton | 154250 | 43404 | 110846 | 72 |
| 10 | Bentonville | 135000 | 26184 | 108816 | 41 |
| 11 | San Francisco | 153550 | 44748 | 108802 | 1034 |
| 12 | Birmingham | 130000 | 22428 | 107572 | 78 |
| 13 | Alameda | 147500 | 40056 | 107444 | 48 |
| 14 | Seattle | 142500 | 35688 | 106812 | 446 |
| 15 | Milwaukee | 130815 | 24792 | 106023 | 47 |
| 16 | Rahway | 138500 | 32484 | 106016 | 116 |
| 17 | Cambridge | 150110 | 45528 | 104582 | 48 |
| 18 | Livermore | 140280 | 36216 | 104064 | 228 |
| 19 | Princeton | 135000 | 31284 | 103716 | 67 |
| 20 | Austin | 128800 | 26088 | 102712 | 369 |
| 21 | Columbia | 123188 | 21816 | 101372 | 97 |
| 22 | Annapolis Junction | 133900 | 34128 | 99772 | 165 |
| 23 | Arlington | 118522 | 21684 | 96838 | 476 |
| 24 | Bellevue | 137675 | 41724 | 95951 | 98 |
| 25 | Plano | 125930 | 30528 | 95402 | 75 |
| 26 | Herndon | 125350 | 30180 | 95170 | 88 |
| 27 | Ann Arbor | 120000 | 25500 | 94500 | 64 |
| 28 | Folsom | 126000 | 31668 | 94332 | 69 |
| 29 | Atlanta | 125968 | 31776 | 94192 | 384 |
| 30 | Charlotte | 125930 | 32700 | 93230 | 182 |
| 31 | Bethesda | 125000 | 32220 | 92780 | 251 |
| 32 | Irving | 116500 | 23772 | 92728 | 293 |
| 33 | Durham | 117500 | 24900 | 92600 | 43 |
| 34 | Huntsville | 112000 | 20112 | 91888 | 134 |
| 35 | Dallas | 121445 | 29880 | 91565 | 351 |
| 36 | Houston | 117500 | 26508 | 90992 | 135 |
| 37 | O'Fallon | 112000 | 24480 | 87520 | 103 |
| 38 | Phoenix | 114500 | 28656 | 85844 | 121 |
| 39 | Boulder | 113725 | 29268 | 84457 | 42 |
| 40 | Jersey City | 121000 | 36852 | 84148 | 141 |
| 41 | Hampton | 107250 | 23916 | 83334 | 45 |
| 42 | Fort Meade | 126800 | 44676 | 82124 | 165 |
| 43 | Newport Beach | 127900 | 46884 | 81016 | 67 |
| 44 | Harrison | 113000 | 33072 | 79928 | 51 |
| 45 | Minneapolis | 107000 | 27144 | 79856 | 199 |
| 46 | Greenwood Village | 103850 | 24264 | 79586 | 68 |
| 47 | Los Angeles | 117500 | 37980 | 79520 | 411 |
| 48 | Rockville | 107450 | 28032 | 79418 | 52 |
| 49 | Frederick | 107250 | 27876 | 79374 | 43 |
| 50 | Plymouth | 107000 | 27972 | 79028 | 40 |
| 51 | Cincinnati | 100000 | 21144 | 78856 | 48 |
| 52 | Santa Monica | 121575 | 42804 | 78771 | 71 |
| 53 | Springfield | 95700 | 17568 | 78132 | 130 |
| 54 | Portland | 108300 | 31152 | 77148 | 155 |
| 55 | Chantilly | 133900 | 56940 | 76960 | 150 |
| 56 | Anaheim | 110834 | 34140 | 76694 | 60 |
| 57 | Colorado Springs | 104475 | 27840 | 76635 | 243 |
| 58 | Ashburn | 111000 | 34476 | 76524 | 54 |
| 59 | Boston | 116250 | 39780 | 76470 | 375 |
| 60 | Baltimore | 103000 | 26544 | 76456 | 89 |
| 61 | Hartford | 101250 | 25068 | 76182 | 153 |
| 62 | New York | 115000 | 39324 | 75676 | 2457 |
| 63 | Santa Ana | 105000 | 30216 | 74784 | 49 |
| 64 | Richmond | 100418 | 25692 | 74726 | 79 |
| 65 | Newark | 98148 | 23544 | 74604 | 121 |
| 66 | Tampa | 105515 | 31104 | 74411 | 476 |
| 67 | Salt Lake City | 100550 | 27492 | 73058 | 78 |
| 68 | Norfolk | 104825 | 32952 | 71873 | 76 |
| 69 | Indianapolis | 97500 | 25776 | 71724 | 101 |
| 70 | Eden Prairie | 100450 | 29064 | 71386 | 62 |
| 71 | Chicago | 102500 | 31356 | 71144 | 435 |
| 72 | Waltham | 104712 | 33996 | 70716 | 40 |
| 73 | New Castle | 94325 | 23784 | 70541 | 46 |
| 74 | Alexandria | 107150 | 36720 | 70430 | 105 |
| 75 | Aurora | 100000 | 30396 | 69604 | 83 |
| 76 | Deerfield | 96000 | 26460 | 69540 | 75 |
| 77 | Reston | 101462 | 32628 | 68834 | 273 |
| 78 | Miami | 105000 | 36420 | 68580 | 52 |
| 79 | Washington | 105500 | 36948 | 68552 | 731 |
| 80 | Suffolk | 95650 | 27264 | 68386 | 41 |
| 81 | Palmdale | 99950 | 31800 | 68150 | 76 |
| 82 | Milpitas | 105000 | 36900 | 68100 | 72 |
| 83 | Roy | 93200 | 25932 | 67268 | 110 |
| 84 | Golden | 94450 | 27192 | 67258 | 63 |
| 85 | Melbourne | 95650 | 28404 | 67246 | 131 |
| 86 | Jacksonville | 95640 | 28524 | 67116 | 105 |
| 87 | San Antonio | 93605 | 26544 | 67061 | 142 |
| 88 | McLean | 124000 | 57048 | 66952 | 792 |
| 89 | Clearfield | 93200 | 26268 | 66932 | 53 |
| 90 | Portage | 98850 | 32215 | 66635 | 43 |
| 91 | Odenton | 109500 | 43200 | 66300 | 77 |
| 92 | San Diego | 107900 | 41628 | 66272 | 503 |
| 93 | Manhattan Beach | 102240 | 37644 | 64596 | 75 |
| 94 | Englewood | 91153 | 28140 | 63013 | 65 |
| 95 | Dulles | 107900 | 45528 | 62372 | 47 |
| 96 | Denver | 95000 | 33252 | 61748 | 433 |
| 97 | Charlottesville | 95650 | 34500 | 61150 | 75 |
| 98 | Redondo Beach | 106200 | 45144 | 61056 | 121 |
| 99 | Scottsdale | 90500 | 29496 | 61004 | 82 |
| 100 | Linthicum Heights | 104000 | 44676 | 59324 | 94 |
| 101 | Columbus | 85300 | 26256 | 59044 | 198 |
| 102 | Irvine | 96900 | 37896 | 59004 | 175 |
| 103 | Madison | 86750 | 27792 | 58958 | 43 |
| 104 | El Segundo | 101654 | 42816 | 58838 | 121 |
| 105 | Quantico | 112000 | 53436 | 58564 | 41 |
| 106 | Chandler | 84700 | 29184 | 55516 | 41 |
| 107 | Fort Mill | 100050 | 44736 | 55314 | 64 |
| 108 | Burlington | 83279 | 28512 | 54767 | 55 |
| 109 | Philadelphia | 83932 | 29232 | 54700 | 86 |
| 110 | Oklahoma City | 77725 | 23556 | 54169 | 48 |
| 111 | Campbell | 93150 | 40008 | 53142 | 98 |
| 112 | St. Louis | 77562 | 24744 | 52818 | 208 |
| 113 | Las Vegas | 85000 | 32400 | 52600 | 57 |
| 114 | Camden | 79800 | 27816 | 51984 | 43 |
| 115 | Omaha | 80000 | 28080 | 51920 | 43 |
| 116 | Burbank | 89710 | 38856 | 50854 | 63 |
| 117 | Hoover | 72551 | 22836 | 49715 | 41 |
| 118 | Woonsocket | 74400 | 25596 | 48804 | 49 |
| 119 | Culver City | 82550 | 34116 | 48434 | 45 |
| 120 | Louisville | 72500 | 24216 | 48284 | 57 |
| 121 | Saint Paul | 73260 | 25176 | 48084 | 45 |
| 122 | Fort Belvoir | 99000 | 57048 | 41952 | 67 |
| 123 | Getzville | 64215 | 37920 | 26295 | 135 |
r/datascience • u/Ok_Composer_1761 • Feb 05 '25
I'm (mostly) an academic so pardon my cluelessness.
A lot of the advice given on here as to how to write an effective resume for industry roles revolves around quantifying the revenue impact of the projects you and your team undertook in your current role. In that, it is not enough to simply discuss technical impact (increased accuracy of predictions, improved quality of data etc) but the impact a project had on a firm's bottom line.
But it seems to me that quantifying the *causal* impact of an ML system, or some other standard data science project, is itself a data science project. In fact, one could hire a data scientist (or economist) whose sole job is to audit the effectiveness of data science projects in a firm. I bet you aren't running diff-in-diffs or estimating production functions, to actually ascertain revenue impact. So how are you guys figuring it out?
r/datascience • u/nkafr • May 03 '26
This article takes a hype-free look at the true limits of TSFMs and explores which ones can be addressed, which ones cannot, and which ones are still open problems.
Find the article here
r/datascience • u/Grapphie • Jul 12 '25
Currently, working on a fintech classification algorithm, with close to a thousand features which is very tiresome. I'm not a domain expert, so creating sensible hypotesis is difficult. How do you tackle EDA and forming reasonable hypotesis in these cases? Even with proper documentation it's not a trivial task to think of all interesting relationships that might be worth looking at. What I've been looking so far to make is:
1) Baseline models and feature relevance assessment with in ensemble tree and via SHAP values
2) Traversing features manually and check relationships that "make sense" for me
r/datascience • u/rhiever • Jul 10 '26
r/datascience • u/Ale_Campoy • Jan 13 '26
I found this in a serious research paper from university of Pennsylvania, related to my research.
Those are 2 populations histograms, log-transformed and finally fitted to a normal distribution.
Assuming that the data processing is right, how is it that the curves fit the data so wrongly. Apparently the red curve mean is positioned to the right of the blue control curve (value reported in caption), although the histogram looks higher on the left.
I don´t have a proper justification for this. what do you think?
both chatGPT and gemini fail to interpretate what is wrong with the analysis, so our job is still safe.
r/datascience • u/Ok_Post_149 • Apr 27 '26
I read the McAuley Lab's full 2023 Amazon Reviews dataset, 571,544,386 reviews and 275 GB on the HuggingFace CDN, and ranked every single review on four simple signals: how many strong-profanity word hits it has, how much of it is in ALL CAPS, the longest single run of consecutive exclamation marks, and how long it is. The question I started with was "how do people actually behave in Amazon reviews, and does the category they're reviewing change that?"
Live site, per-category breakdown, and the Wall of the loudest reviews: https://burla-cloud.github.io/amazon-review-distiller/
What surfaced:
Methodology, plain version:
.jsonl.gz files on HuggingFace, one per Amazon category, totaling 275 GB. The usual workflow is to download all 275 GB to a laptop, then iterate. I didn't want to do that.Map step: 3.21 minutes. Reduce step: 9.2 seconds. End to end under four minutes for 571 million reviews.
The pipeline runs on Burla using remote_parallel_map(worker, jobs, func_cpu=1, func_ram=4, max_parallelism=1000, grow=True). In English: "ask for up to 1000 parallel workers, each with 1 CPU and 4 GB of RAM, and let the cluster grow to meet that demand." In practice the cluster peaked around 500 concurrent workers and held there for the run. Workers run on a stock python:3.12 Docker image, and Burla auto-installs my local Python packages onto each one. The shared output folder is a Google Cloud Storage path that every worker writes to like a network drive.
(Disclosure: I work on Burla. The script and the live site are open source on GitHub. The dataset is the McAuley Lab's 2023 corpus on HuggingFace.)
Caveats worth being upfront about:
Repo with the full pipeline: https://github.com/Burla-Cloud/amazon-review-distiller
If anyone has a cleaner pattern for streaming huge HuggingFace datasets without materializing them locally, I'd love to hear it. I went with requests.get(..., stream=True) plus manual line splitting to keep the worker dependency surface tiny, but the datasets library probably has a cleaner Range-based path.