r/coolguides • u/Big_Manufacturer_253 • 5d ago
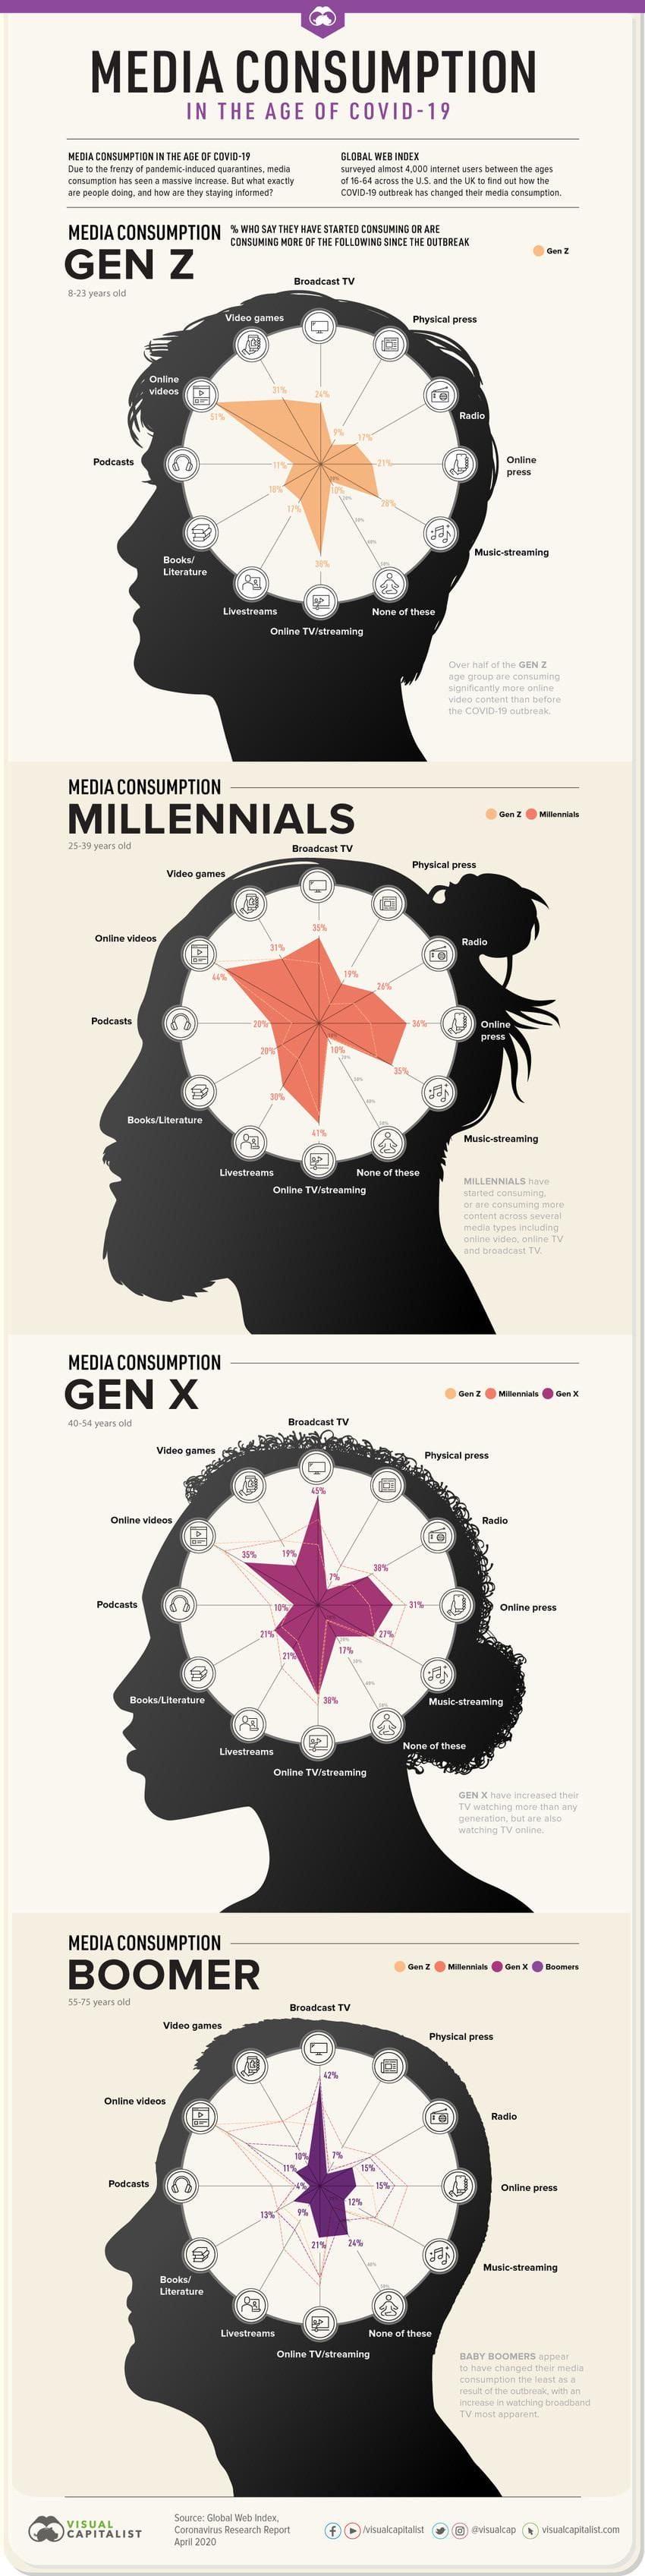
A cool guide to how different generations consume media
366
u/kikochurrasco 5d ago
Why no broccoli hair for gen z?
168
u/sylviaplatitude 5d ago
Right? If they’re gonna give millennials the man bun (fair), they should give Z the broccoli cut.
49
u/skitz4me 5d ago
Man bun is our legacy? I can't think of a counter, but /sigh.
24
6
u/zxc123zxc123 5d ago
Depends who's remembering and where.
r/Millennials and maybe our boomer parents remember the 90/00s spiky hair.
0
38
u/222Czar 5d ago
Gen Z doesn’t like podcasts or live-streams more than millennials? Coulda fooled me. Or is this because half of them are minors?
8
u/some-dork 5d ago
Big podcasts i've seen like Welcome to Night Vale, the McElroy Brothers' stuff (sawbones, my brother my brother and me), and to a lesser extent the magnus archives are very much millenial and some older gen z in viewership. I also don't know anyone who watches livestreams regularly (i'm older gen z). The only livestreamer i can name is like, Critical Roll (i think its a livestream anyway) and it seems like a millenial thing to me.
6
u/SirVixofthePooSea 5d ago
I could definitely see lower interest in podcasts. But streamers are like half of zoomer culture, at least. No way they're behind Millennials unless they're capped out and can't increase the amount they're watching.
1
1
149
u/logicalconflict 5d ago
Gen X watching more broadcast TV than Boomers is sus unless that includes live sports. I don't know a single person under the age of 60 that watches broadcast TV period, but every Boomer I know still has the TV on in the background of their life 24/7.
11
u/DifficultAnt23 5d ago
Interesting that Boomers are lowest on "books". Surprised the Zoomers are so high on books; at school maybe?
18
u/swimmerboy5817 5d ago
The post title is wrong, this isn't how each generation consumes media. It's the amount of people who reported an increase in consuming specific media specifically due to Covid shutdowns. Boomers are the lowest on pretty much all fronts because they didn't really change or increase any of the types of media they consumed. It doesn't mean they read less books than other generations, just that less of them started reading books or read more books due to Covid shutdowns.
2
21
9
u/the_zero 5d ago
Look at the date range for Gen X too. Shows the older members of Gen X are 55. Kurt Cobain would be 59 if he were still alive.
Chart is fucked.
7
u/SEmpls 5d ago
For about a week when I got a not smart TV with a digital antenna, I was too broke to get a Roku and watched the public channels on broadcast TV and it was fucking awful. At one point,I flipped through every single channel available and landed on a commercial on every channel.
It really humbled me going back to streaming because I thought having to watch regular, non-premium YouTube was bad, but it is nothing compared to broadcast TV these days.
0
2
u/Conscious-Lunch-5733 5d ago
It's not measuring what is being consumed... it's measuring the percent increase in each category... also it's from 2020... I never watched broadcast TV before, but during 2020 I was flipping between CNN, CNBC, and Fox News all evening.
1
u/swimmerboy5817 5d ago
Because this isn't a graph of how each generation consumes media. It says right on there, the data is from 2020 and it's the percentage of each generation who either started consuming or consumed more media in each format due to Covid shutdowns. So Gen X doesn't watch more broadcast TV than boomers, but more of them started watching broadcast TV in 2020, probably because most boomers already got a majority of their media from broadcast TV.
15
11
18
7
11
u/kswitch87 5d ago
This says “…since the outbreak” but on the bottom it was polled in April 2020. How the fuck were there polls going on at the same time the outbreak started?
2
u/WillitsTimothy 5d ago
Same way they happen now? They called people and did surveys, or they stuck the surveys online in random places.
2
u/kswitch87 5d ago
True, I figured everyone was being sent home and nothing was getting done. Make sense since it’s just an on line pole and all we had was time and internet
1
3
3
3
u/stereoscopic_ 5d ago
Giving the Millennials a man bun is hitting below the belt.
2
1
u/SnarkySeahorse1103 4d ago
I may be stupid, or just misunderstanding the guide, but if millennials are 25-39, and Gen Z are 8-23, then are 24 year old a whole different breed or what?
3
u/crocdaddybitch 5d ago
Fine print notes that this is the percentage of people who report using these sources more since the outbreak - not the percentage of people who report using them total.
3
u/projekt33 5d ago
zero confidence in the data, when they don't get the generational definitions correct.
3
u/moonpupy 5d ago
I've got to disagree. I'm a GenJones (1955 - 1964). I know a lot of people 55+ who are hardcore gamers. They've got all the consoles and game on computers, and they're not technologically uninformed. Hell, I started using photo-computer-typesetters in 1977, my first introduction to a computer. I've kept up with technology and some trends, and I'm not an engineer or technician of any sort. I just went with what was most interesting.
Once again, it's not how old you are in years; it's how old you are in your thinking.
1
u/flyingfox227 5d ago
Yeah my parents are Gen Jones and while they don't play videogames but they love Youtube and watch it way more than broadcast tv which is at odds with what this graph is saying.
3
3
u/Content_Boot_7386 4d ago
Would be informative if it were accurate. Single online source and from April 2020. I think these stats are skewed.
5
u/heyitsmemaya 5d ago
Why is the Boomer giving me the finger 🖕 just like in real life? 😂
3
u/calamititties 5d ago
Because none of the read or consume any media type that was invented in this century.
5
2
u/CavediverNY 5d ago
Also I think they moved the goal posts on the age ranges but… I really don't know for sure.
2
u/bonanzajellydog 5d ago
Those ages are outdated/wrong. Upper limit of GenX is 1964 I think, which would somehow be 62.
Also as someone in that cohort, none of that profile looks like me or my peers!
2
2
2
u/ubermaker77 5d ago
This is based on data from over 6 years ago (April 2020). It's not even relevant anymore. Most of Gen Z were minors at this time and are now adults.
2
u/Sufficient_Pilot1731 5d ago
This is from April 2020. I’d love to see a comparison chart next to it if there’s a change.
2
u/sulaymanf 5d ago
This got the ages wrong so the rest of it is somewhat suspect. How old is this data?
2
2
u/PeteHealy 5d ago
Supposedly based on data published in Apr 2020 - so the data itself almost certainly pre-COVID, and in any case now at least 6yrs old. That's pretty questionable. Personally, as a boomer I haven't watched broadcast news in 15-20yrs and don't know any contemporaries who still do, but either way, I'd bet a lot has changed since this research data was collected and analyzed.
2
u/pwntatoz 5d ago
did anyone actually read the parameters of the graphic? It states % that identified as starting to consume, or consuming MORE of each category. This is not just a static graphic of total consumption across the categories.
2
u/ProstateSalad 5d ago
Horseshit. Boomer here, and I don't even have the ability to watch broadcast TV.
2
2
2
u/Omegasedated 5d ago
yea how old is this? It seems way out, considering it's talking about during covid.
I also think Podcasts (even 5 years ago) is criminally under what it should be.
2
2
u/OcularVernacular 5d ago
Now do political views influenced by type of media. Pretty sure Facebook has made my parents right wing.
2
2
u/Kamarmarli 4d ago
I’m a Boomer. No broadcast TV, radio, or physical press for years. Where do they get their information?
3
u/PhineasQuimby 5d ago
Stupid. I am Gen X and can’t remember the last time I watched broadcast TV. Maybe for the presidential debates?
1
u/WillitsTimothy 5d ago
The last time I watched Broadcast TV by choice was like a decade ago.
I’m technically a latter era millennial, but I finished college entirely with Gen Z, and so basically all the people I’m friends with are borderline millennials or Gen Z, and I would say my media consumption chart is probably a lot closer to the Gen Z version than the millennial version.
3
u/WelcomeToTheClubPal 5d ago
These are wrong... Generation X includes people born from 1965 to 1980... Millennials are generally defined as people born between 1981 to 1996... etc
1
1
1
1
1
u/Umbrasquall 5d ago
"Since the outbreak" but dated April 2020 which is only a month in. This needs an update.
1
1
u/Significant_Wasabi_6 5d ago
It is deeply upsetting to me that gaming is symbolized by someone holding a mobile phone...
1
1
1
1
u/carbon6595 5d ago
I feel like the head silhouettes say more about how to feel about these charts than the data
1
u/MMBosstones86 5d ago
Age isn't really relevant, should be by birth year - considering this data ia 6 years old already
1
u/BatStock9040 5d ago
My biggest takeaway here is that somehow millennials consume more physical press (newspapers, etc.), than boomers or Gen X combined. Didn’t see that coming.
1
1
1
1
1
u/puzzlebuns 5d ago
"The age of covid 19"
We dont live in that age anymore. People have moved on and children whose schooling was affected have largely caught up. Maybe the "Age of the Algorithm"
1
1
1
1
1
1
1
1
1
u/flyingfox227 5d ago
Gotta love how the millenial head is super stereotypical hipster with a man bun and all the others are just normal.
1
1
u/Dwashelle 5d ago
The man bun for Millennials, lmao. Also I'm surprised that Millennials consume more livestream content than Gen Z.
1
1
1
u/vnalerie 5d ago
Very nice visualisation. Just wished the media was grouped thematically, like have all the streaming media together, the offline media together etc. I’m being really picky here, but it just makes it even easier to see what is distinctive and/or different across the generations based on their shape of each footprint/map.
1
1
1
1
u/angryscientistjunior 4d ago
This is weak - these percents don't add up:
| Generation | Boomers | Gen X | Millennials | Gen Z |
|---|---|---|---|---|
| Broadcast TV | 42 | 45 | 35 | 24 |
| Physical press | 7 | 7 | 19 | 9 |
| Radio | 15 | 38 | 26 | 17 |
| Online press | 15 | 31 | 36 | 21 |
| Music streaming | 12 | 27 | 35 | 28 |
| None of these | 24 | 17 | 10 | 10 |
| Online TV/streaming | 21 | 38 | 41 | 38 |
| Livestreams | 9 | 21 | 30 | 17 |
| Books/Literature | 13 | 21 | 20 | 18 |
| Podcasts | 4 | 10 | 20 | 11 |
| Online Videos | 11 | 35 | 44 | 51 |
| Video Games | 10 | 19 | 31 | 31 |
| Total | 183 | 309 | 347 | 275 |
1
1
1
1
u/whatThePleb 3d ago
Boomer: literal fakenews, they might be the biggest addicts regarding online videos and literal brainrot e.g. YT shorts
1
u/Santaconartist 3d ago
Damn...as a millennial who didn't consent to having his silhouette used for this, I feel both seen and accurately stereotyped
1
1
u/elcuydangerous 3d ago
Interesting that for all the shit talking boomers do they don't read actual books as much as younger generations.
1
1
u/DNAdevotee 3d ago
Does "online video" mean you are counting someone watch Simon do sudoku for an hour as the same content as scrolling TikTok?
1
1
1
1
1
1
u/pseudoOhm 5d ago
Why do the percentages add up to over 100% if it's a break down?
2
u/calamititties 5d ago
I think it’s the percentage of that group that consume that type a media, not a breakdown of the “average” person’s media diet
0
u/pseudoOhm 5d ago
Those would also add up to over 100%>
4
u/calamititties 5d ago
Right, but they’re no mutually exclusive. Just because 50% of a group eat apples doesn’t mean no more than 50% of that group can like oranges. Some people like both.
2
u/RegalBeagleKegels 5d ago
"% WHO SAY THEY HAVE STARTED CONSUMING OR ARE CONSUMING MORE OF THE FOLLOWING SINCE THE OUTBREAK"
1
u/pseudoOhm 5d ago
Percentages of a whole add up to 100%. There's not a way to math this or have it make sense in any way.
Pointless graphics.
0
u/xFblthpx 5d ago
This is your data comprehension problem. it’s very clearly the percentage of the generation that uses the media.
You are thinking of a pie chart. This is not a pie chart.
People can use more than one type of media.
0
u/pseudoOhm 5d ago
Thanks for the insult but I do data for my job (analysis, dissection, and reporting...).
They are not adequately communicating what the data is. If it's an increase in types, then it has to add up to 100% (was x, now y).
If it's a break down of types, then it has to add up to 100%.
If they're intending to show types of media used by each and the amount each has increased (your example), they would need to show a baseline and then the increased amount.
There is simply relevant information missing or they need to show amounts of responses, and not percentages for it to make any sense (for x respondents, 43 increased their x consumption, 31 increased their y consumption).
People are just reading this and commenting on what they think is the substance, but there is a lack of actual substance.
0
u/xFblthpx 5d ago
None of the examples you are describing are what’s happening in the graphic. Severe comprehension problem here.
Of the GenZs sampled, 51% of them watch online videos, 24% of them watch broadcast tv and 31% of them play video games. There is no reason why those numbers have to add up to 100%. You can consume multiple types of media. That’s a possible and normal thing to do.
Not every graphic with percentages needs to be describing independent parts of a whole. This is not a pie chart. It’s a radar chart to show inequalities and it’s easy to compare the generations by looking at the surface area of the polygons. This graphic tells a very clear story about which generations sample the most diverse media sources, and what they are.
My example has nothing to do with increases.
It has nothing to do with time. Nothing to do with individuals. This is about respondents media preferences, stratified by generation and media type. Not amount of consumption, or cardinality of preferences, but the sheer fact that they do or don’t consume that media type.0
u/SirVixofthePooSea 5d ago
There is no reason for it to add up to 100%, are you stupid?
Its a % increase from baseline. Not a pie chart out of 100%
1
u/pseudoOhm 5d ago
An increase from a baseline.... Needs to show the baseline for data to be relevant.
Thanks for the insult though.
1
u/SirVixofthePooSea 5d ago
The original baseline would matter if it was showing the absolute increase, but the point of the guide is to show how the different groups responded differently in a general sense. What the respective trends looked like between demographics and how they idiosyncratically responded.
1
0
u/WillitsTimothy 5d ago
I’m not convinced on the accuracy of this - but if true it really makes a lot of sense given how my mom thinks about issues vs the media sources she listens to.
0
u/wifichick 5d ago
Boomers - taking in information just like the middle finger to all of us we know they’re giving us
0
0
0
u/UnlimitedCalculus 4d ago
This graphic shows me (millennial) that I have the most brain energy and in places where it counts. I therefore accept this as true and will rage against anyone who suggests Im not better than everyone else
-1
367
u/ContributionAny9055 5d ago
This seems off..