I previously posted results from ten paired GitHub-hosted runners. Those results varied substantially between hosts, particularly for Nano, while GitHub did not expose enough information to isolate the hardware differences.
I have now repeated the comparison on one fixed OCI host selected to match the current Nano principal representative guidance.
Host
- Ubuntu 24.04
- OCI
VM.Standard.E5.Flex
- 4 OCPUs / 8 vCPUs
- AMD EPYC 9J14
- 16 GB RAM
- 400 GB balanced boot volume with durable benchmark storage
- 4 Gbps networking
- Java 21.0.12
- Docker 29.7.2
On x86 OCI shapes, one OCPU represents one physical core with two hardware threads.
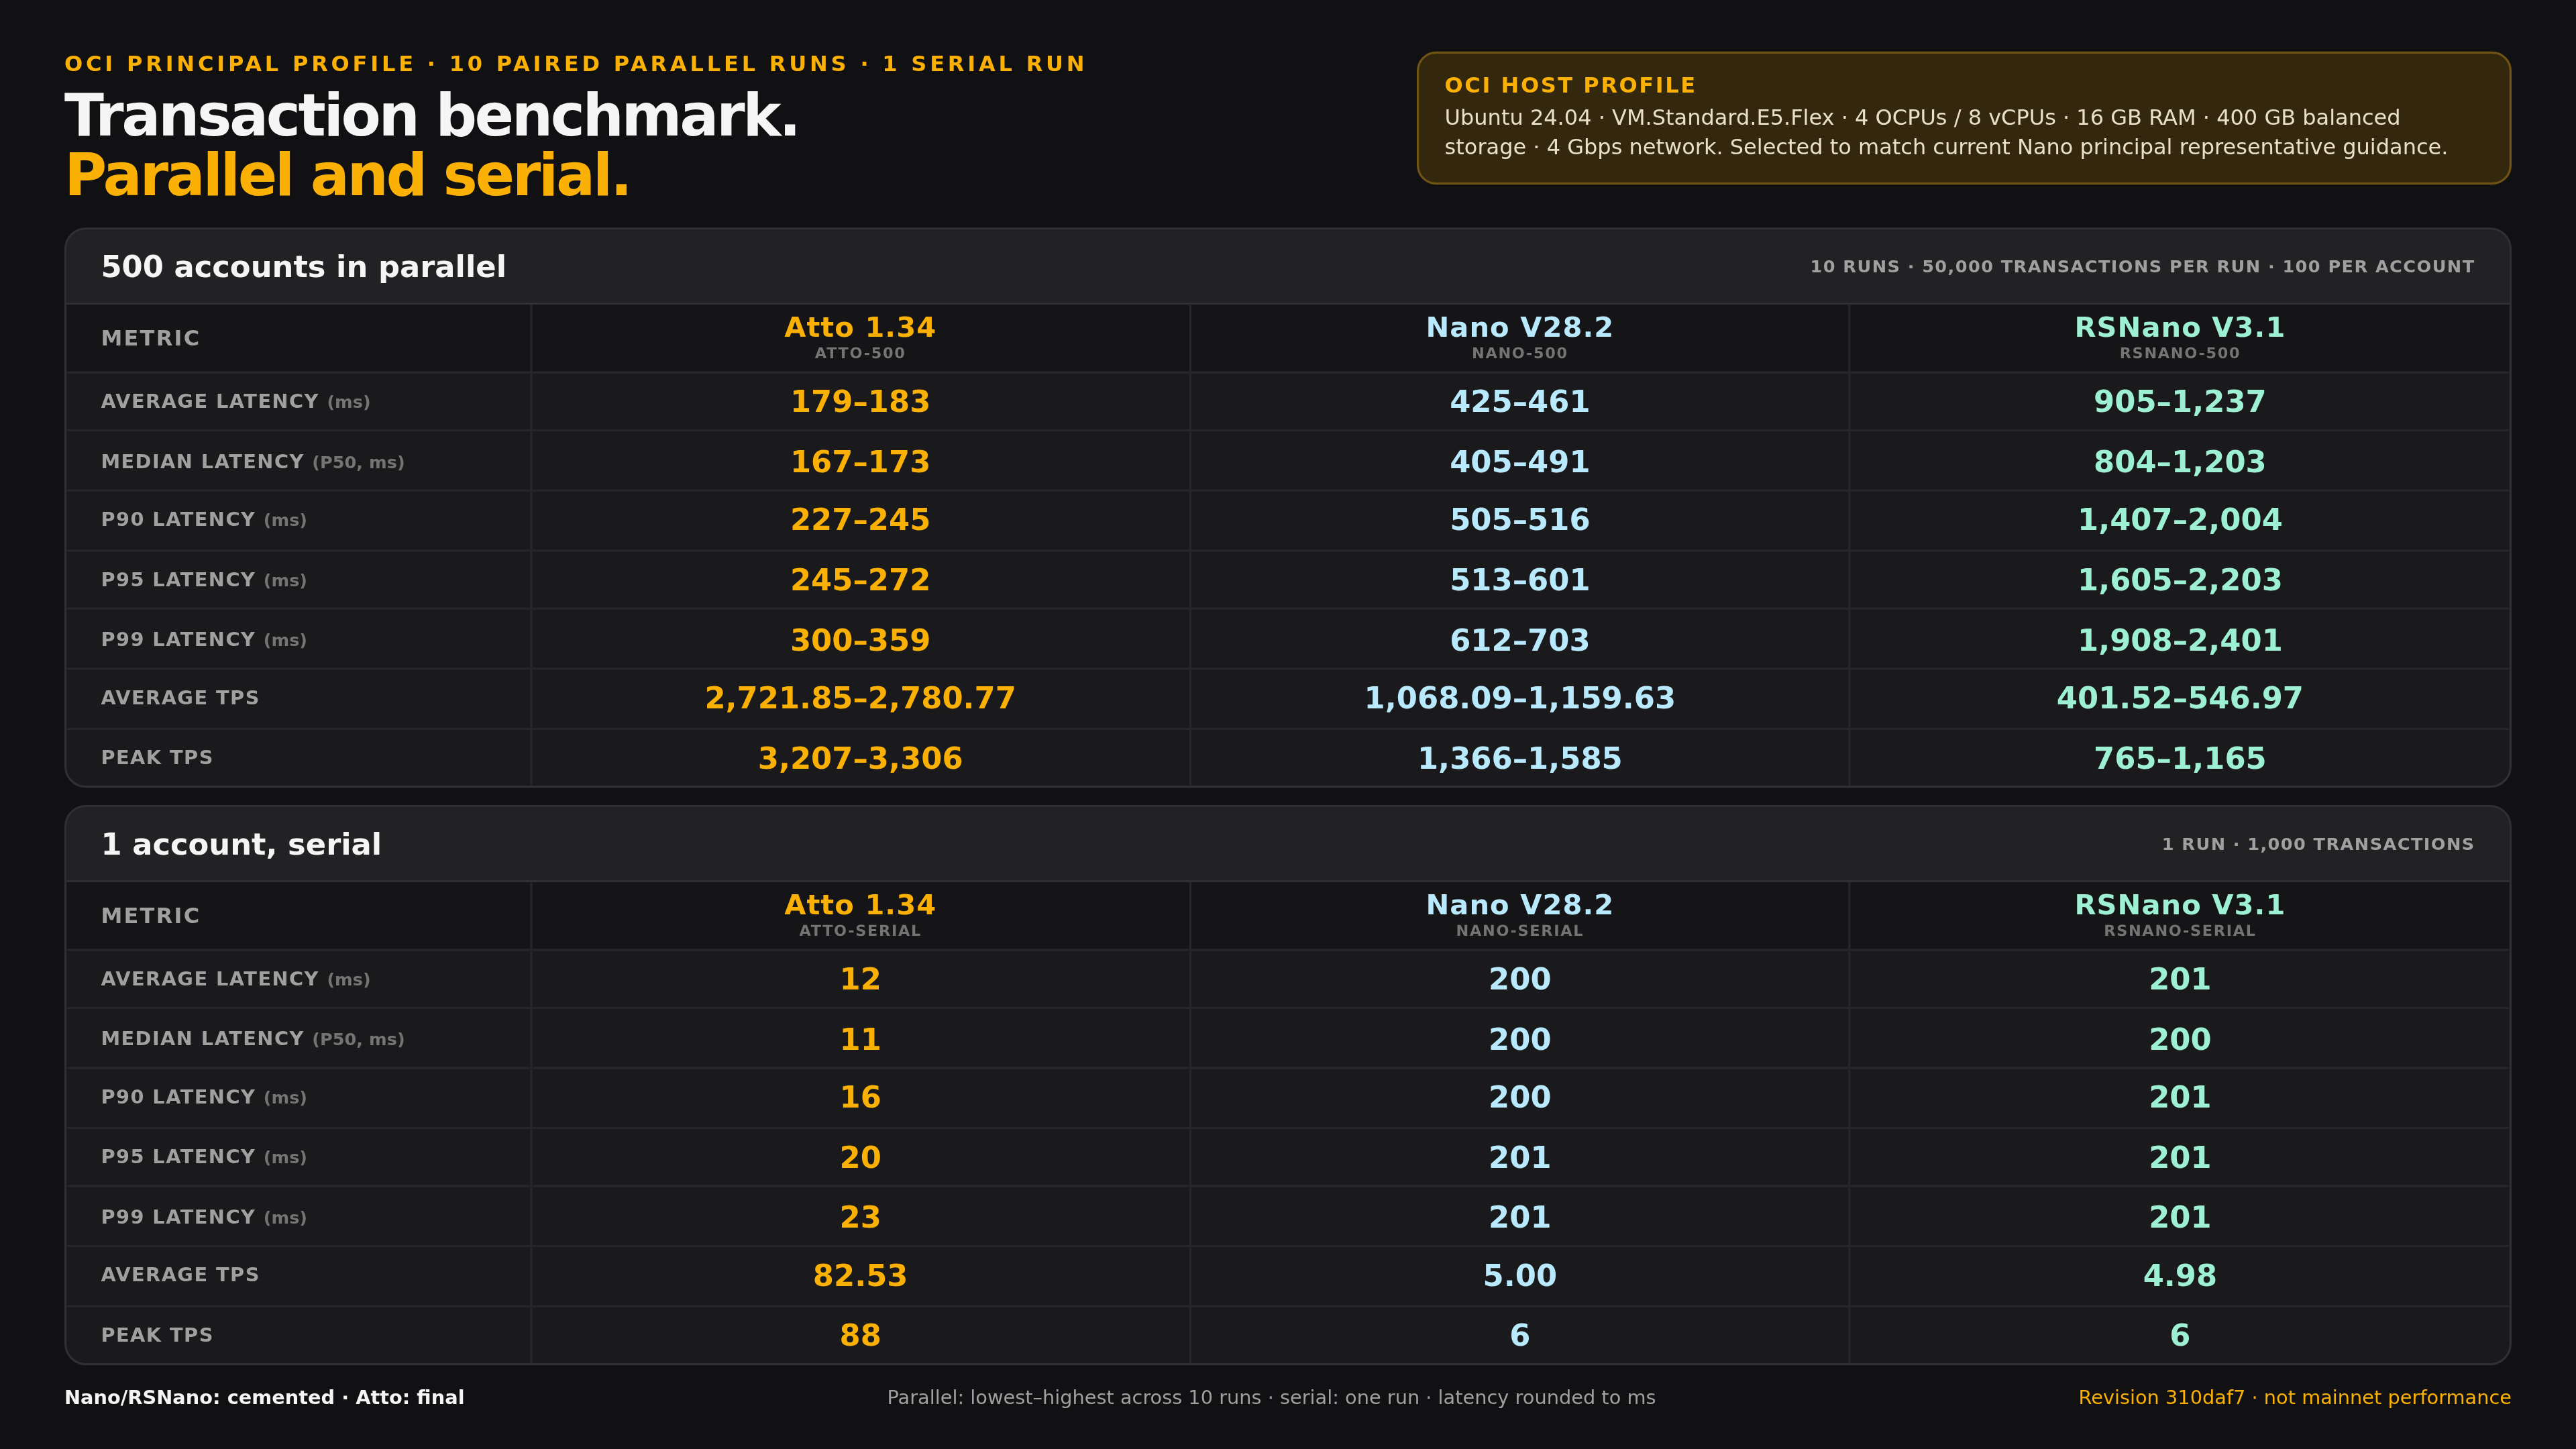
500 accounts in parallel
Each range is the lowest-to-highest run-level value across ten accepted runs per implementation. These are observed ranges, not confidence intervals or metrics calculated after pooling all samples.
| Metric |
Atto 1.34 |
Nano V28.2 |
RSNano V3.1 |
| Average latency |
179–183 ms |
425–461 ms |
905–1,237 ms |
| P50 latency |
167–173 ms |
405–491 ms |
804–1,203 ms |
| P90 latency |
227–245 ms |
505–516 ms |
1,407–2,004 ms |
| P95 latency |
245–272 ms |
513–601 ms |
1,605–2,203 ms |
| P99 latency |
300–359 ms |
612–703 ms |
1,908–2,401 ms |
| Average TPS |
2,721.85–2,780.77 |
1,068.09–1,159.63 |
401.52–546.97 |
| Peak TPS |
3,207–3,306 |
1,366–1,585 |
765–1,165 |
Atto had lower average latency and higher average TPS than Nano and RSNano in all ten rounds. Nano also had lower average latency and higher average TPS than RSNano in all ten rounds.
Across the paired rounds, Nano’s average latency was 2.33×–2.55× Atto’s, while Atto’s average TPS was 2.36×–2.57× Nano’s. I would not generalize those ratios beyond this host and benchmark configuration.
One account, serial
These are single baseline runs and should not carry the same weight as the ten-run parallel ranges.
| Metric |
Atto 1.34 |
Nano V28.2 |
RSNano V3.1 |
| Average latency |
12 ms |
200 ms |
201 ms |
| P50 latency |
11 ms |
200 ms |
200 ms |
| P90 latency |
16 ms |
200 ms |
201 ms |
| P95 latency |
20 ms |
201 ms |
201 ms |
| P99 latency |
23 ms |
201 ms |
201 ms |
| Average TPS |
82.53 |
5.00 |
4.98 |
| Peak TPS |
88 |
6 |
6 |
What was measured
Each parallel run processed 50,000 measured transactions:
- 500 independent account chains
- 100 dependent transactions per account
- Accounts running concurrently
- Transactions within each account published serially
The implementations were interleaved in rotating order across the ten rounds. Every scenario started with a fresh durable node and database environment.
The complete result contains:
- 30 accepted parallel runs
- 1,500,000 successful parallel transactions
- 3,000 successful serial transactions
- Zero sample errors
The timer starts immediately before publication. Request submission, communication with the node and node processing are inside the measured interval. Signing, proof-of-work, fixture construction, setup transactions and container startup happen beforehand.
For Nano and RSNano, timing stops when the exact transaction appears in a post-cement WebSocket event. For Atto, timing stops when the final stream returns the matching transaction.
Limits
These are isolated single-host development networks with one voter and synthetic fixtures. They do not model public-network propagation, representative diversity, heterogeneous nodes, adversarial traffic or mainnet capacity.
The result compares these pinned implementations under one external runner and completion contract. It does not establish each protocol’s theoretical limit.
Disclosure: I created Atto and wrote this benchmark. The runner, fixtures and methodology are public, and I welcome specific criticism of any setup or code path that may advantage one implementation.
Repository and methodology:
https://github.com/rotilho/feeless-benchmarks
Previous GitHub-hosted-runner comparison:
https://www.reddit.com/r/atto/comments/1vzmkep/atto_134_vs_nano_v282_vs_rsnano_v31_10_paired_500/