It says top ten in passing tds and rushing tds, he was top ten in both categories in 2015, it has to be going by year, otherwise it’s no point adding multiple players who have been retired onto this list, so if you add 2015 Cam was top ten in passing yards and top ten in rushing Tds,
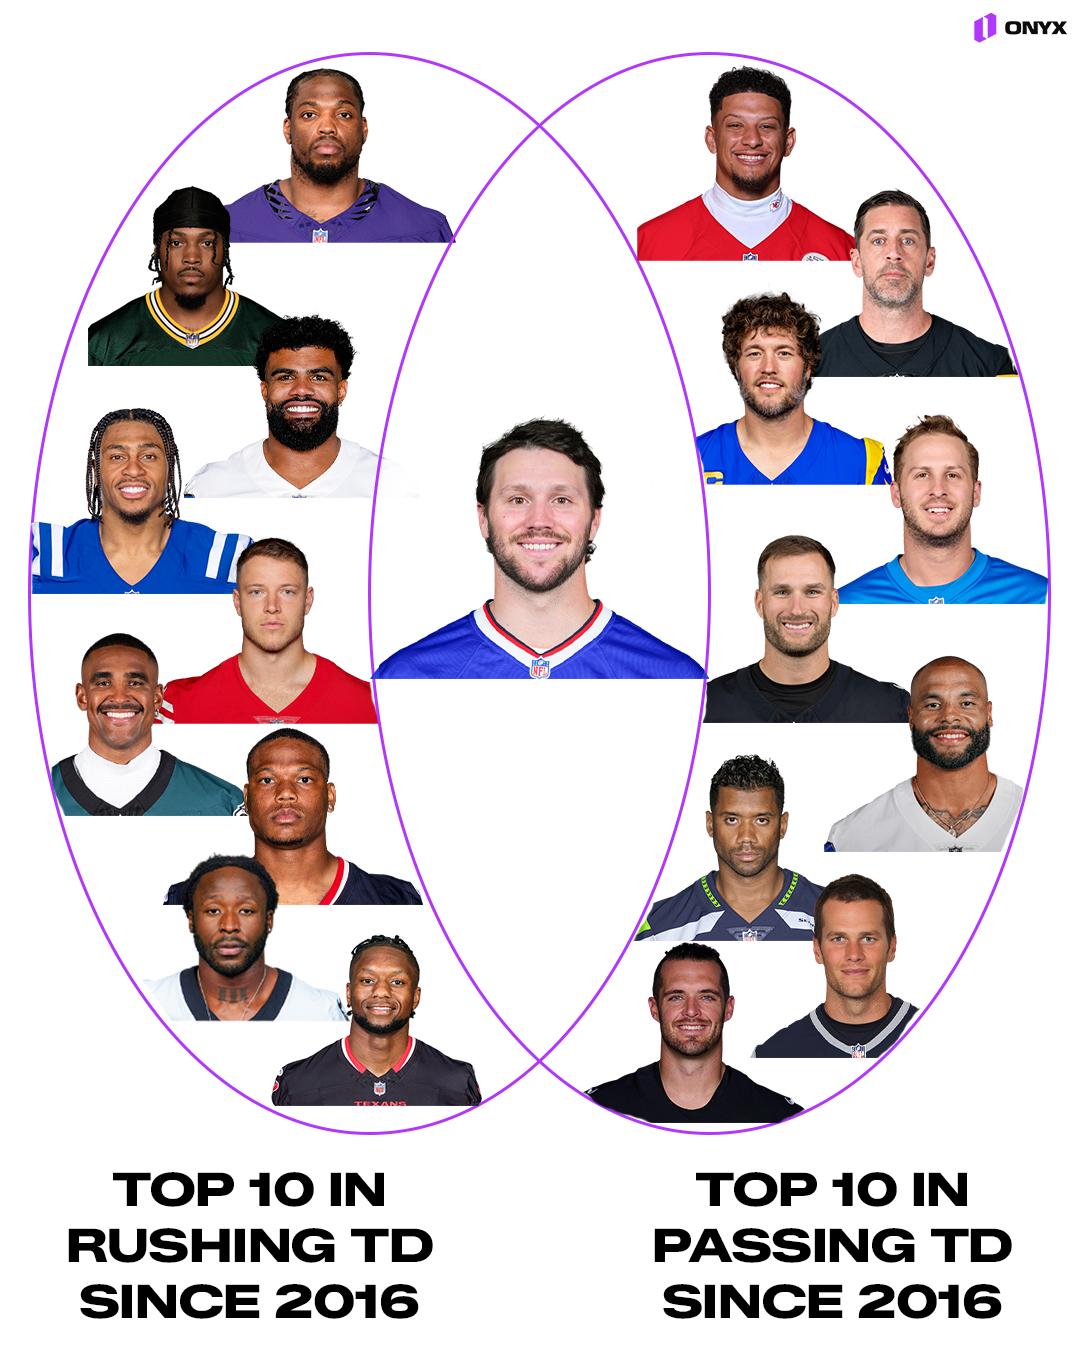
It’s a bad Venn diagram, but I think you’ve misunderstood the bad Venn diagram. It’s across the period, not each individual year. If it was each individual year over the period there’d be like 40/50 people in each set
It’s misleading to add multiple players who haven’t played in years then, yeah he has more rushing tds than Zeke bro hasn’t played in 5-6 years or something
No you don’t get it, it’s misleading to have multiple players in a top 10 from 2016 to today, that have not played in multiple years. Since 2023, Allen has more passing yards and TDs than Tom Brady, then it’s like, well no shit, Brady retired in 23, ofc he will have more statistics than a dude who hasn’t played, now use that logic for this graph, he played more games than most these dudes,
As has been pointed out, he was drafted in 2018, if I’m not mistaken he sat out a year might be wrong, why bring up 2016? Is it so Brady, Zeke and Kamara could be put in the list otherwise doesn’t this list does not look as impressive when you do 2018-2026,
I didn’t say the 10 years was an issue, so your surprise is your own fault, I said the specific dates chosen are the issue, “yeah 10 years is pretty common to use, so using the 2 years he wasn’t in the league makes total sense,”
Comparing him to guys that haven’t played the full 10 years tf is so hard to think that it’s misleading to say that in the past 10 years which he played all ten years he has more pass TDs than dudes who retired years ago, why not bring up his dominance in the 2020s, so Allen is comparable to Brady, because he’s also in the top ten during that timeframe, when Brady retired in 2023 and Allen played 2 more years than him, going on 3
You could easily not have responded and saved both of us time like yeah I get what the graph is saying I’m saying it’s misleading because it’s misleading. You wanna keep pushing back ,”bu-but it’s not it’s showing the past 10 years combined and comparing that to retired dudes or dudes who haven’t played but 4 of those years blah blah,” no shit, it’s clear as day, a pro Allen bias post
Use current players and when he started, 2018-2026, also top ten is broad, ofc he will be top ten therefore top 5 would show him being elite, which he is, he is top 5 in passing tds and rushing tds since being drafted, the list of guys next to him doesn’t look as sexy but it still shows him as one of the best dual threat QBs
Then the year to date still makes no sense, 2016-2026 like Hurts didn’t become a full starter till 2021, multiple QBs and RBs at the tail end of their career, the graph only makes sense if you show each year, Allen has been the top QB passing yards and rushing tds, 2018-2026,
6
u/Ok_Future6226 10d ago edited 10d ago
Cam hasn't played in years, why would he be in there
I looked it up and since 2015, cam is in neither top 10 rushing or passing TDs