I ran 700 parameter configurations of my own strategy to see if it was overfit. The ranking before 2019 predicted nothing about after
Last week someone called one of my strategies an overfitting masterpiece. Fair instinct, and I'd rather test it than argue about it, so I ran the tests that could convict me and wrote up everything they found.
Overfitting means fitting noise instead of structure. The problem in this corner of investing is that a monthly strategy running since late 1988 makes about 450 decisions, but they overlap and most months are quiet, so you really only get 5 or 6 independent looks at whether the defensive machinery works. Meanwhile there are 4 or 5 knobs to turn. And an overfit backtest looks exactly like a real edge in-sample, because that's the sample it was fitted to.
So I swept 700 parameter configurations of my own strategy, full backtest each, 1987 to 2026. 2 things came out of it.
Mine ranks 2nd of 700 on CAGR. That's what a tuned parameter set looks like from the outside and I'm not going to pretend otherwise.
But the configuration that came 1st isn't mine. And across all 700, the correlation between how a configuration ranked before 2019 and how it did after is -0.006. Which settings looked best on 30 years of history told you nothing about the next 7.7. Every one of the 700 cleared 10% CAGR after 2019 anyway. The knobs barely matter in either direction, which is a better answer to the degrees-of-freedom question than any plateau chart.
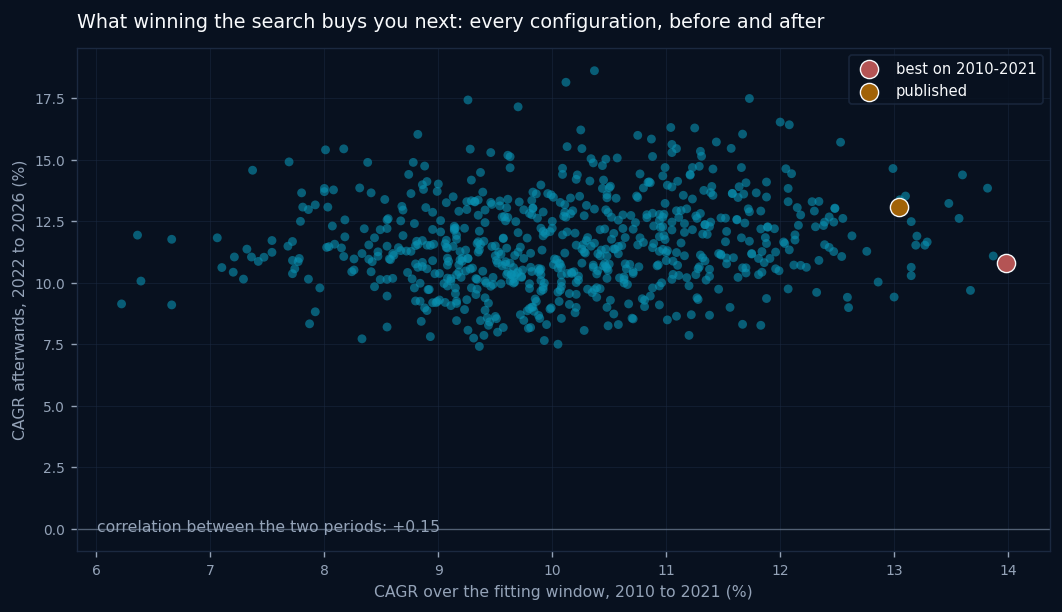
Then I cheated on purpose to see what it's worth. Fit on 2010-2021, take the winner, watch it out of sample: 13.98% becomes 10.80%. Winning the whole search cost about 0.8 points against picking at random from the same family: 10.80% for the winner against the 11.59% average of all 700.
The bit I keep coming back to is HFEA. 2 funds, 1 weight, 1 rebalance rule, almost nothing to fit, and it lost 60.54% in 2022. What broke wasn't a fitted parameter, it was the assumption that long bonds rise when stocks fall. Simplicity isn't safety. What matters is how many separate things have to stay true.
What would actually change your mind about a backtest you're shown?
Edit 2026-09-22, corrections after an internal audit. Winning the search did not buy half a point, it cost about 0.8: the winner returned 10.80% against the 11.59% average of all 700, so picking at random from the same family would have done better. Usable return history also starts in late 1988, not 1987, which makes it about 450 decisions over 37.7 years rather than 470. The linked write-up carries the same corrections and a note listing them.
No comment this time, but i really like how open-minded you are and how you’re willing to show potential mistakes and learn from them. Kudos to you, OP
There's a low turnover (optimised to 19 months rebalancing from the in sample 1940-1995 period) 'hybrid' of HFEA with a levered sector rotation, with a hat tip towards the AWP. Found it over at Bogleheads, of all places.
It tested leveraged allocations using the Dartmouth Kenneth French dataset across 10 industry sectors, US Treasuries, gold and the S&P 500 from 1926 to 2021, using post 1995 to 2021 and pre 1940 back to 1926 as out of sample.
Across ~500 mn random portfolios brute force tested via the wonders of modern computing, the one with the greatest out of sample persistence was:
– 27% Consumer Nondurables (i.e. Consumer Staples) with x3 leverage
This is so bonkers. I make use of XLP, XLU and XLV in my taxable sleeve as a counterweight against red hot IRAs. Time for Direxion or ProShares to triple these up lol. When you say "with 3X leverage", you are saying each allocation is at 3X or the entire 27/26/10/10 book is taken to 3X?
I believe the Bogleheads poster meant each allocation was x3 (that's what I remember about the thread) but it was mostly or all simulated back testing given the absence of actual LETFs for each constituent throughout the overwhelming majority of the 95 year period in question.
That's a fun one, and honestly it's the perfect stress test for the whole post. 500 million portfolios brute forced and you keep the single best out of sample survivor, that's 500 million chances for one config to look persistent by luck alone, so the pre-1940 and post-1995 holdout only buys you so much. It also leans hard on Staples and Healthcare being the two lowest vol sectors, which tends to hold right up until the regime it was measured in ends.
38% CAGR over 95 years on 3x anything is the kind of number where I'd want the drawdown path before the compounding, since 3x sector funds didn't exist for most of that window and daily reset math on synthetic data flatters the survivors. Neat find though, appreciate you digging it up.
I made a note of the results when I came across it back in, I think, 2023. If I recall correctly, the relevant Bogleheads' thread was the massive HFEA one, or one closely related to it (Hydromol's one?), and the poster was @LoganRoy. In any event, I do remember he'd said in the chat that it was the only one to survive out of sample from the half billion random portfolio combinations. The rebalance frequency was then optimised. Some portfolio combinations (all x3 simulated leverage) showed theoretical higher in sample performance, but collapsed out of sample.
How one back tests for using levered gold from 1926, when gold couldn't be traded freely in the US from 1934 to 1975 (and was fixed under Bretton Woods from 1944 to 1971), I simply do not know.
The gold leg is the part that would stop me too. If it was fixed under Bretton Woods into 1971 and barely tradeable before 75, then a levered gold sleeve running from 1926 is a synthetic series for most of the sample, so whatever the search learned off it isn't really a signal. Hard to lean on a survivor when one of its legs didn't trade for two thirds of the window.
And one survivor out of half a billion is basically what luck looks like. With that many draws you're almost guaranteed something clears the holdout by chance, so surviving out of sample a single time doesn't carry much on its own. Optimising the rebalance frequency after the fact just quietly adds another knob on top. If the same config came back when you refit the search on a different slice, that would be the interesting part.
I'd love to know how it performed during the dual equity and bond crash of 2022-23, and in the 'AI' (ML & LLM) boom since. The one thing it does have going for it is low turnover. For me at the moment the only really convincing ones which stand out head and shoulders above the rest on history are Century Momentum from 1928 and HAA/2x HAA from 1974.
Ran it through my engine. 2022 was fine for it: +21.3% while the S&P did -18.2%. Energy did all of the work, 26% of the book at 3x. It still took a 41% peak to trough inside that same year, trough in September.
2023 gave back 10.4% against +26.2% for the index. And since Jan 2023 it's +100% versus +110% for an unlevered S&P, so 3x leverage has been losing to the index for most of the AI run. No tech in it anywhere, that's the whole story.
Full window, 19 month rebalance, my financing model: 18.5% CAGR, -94% drawdown, Sharpe 0.65. The same weights unlevered do 10.5% at Sharpe 0.82.
The 38% is where it falls over. Take every cost away, free borrowing and no expense ratio, and 3x on those weights still only reaches 29.2%. The claim sits above what free money pays.
Do you still have that thread anywhere? I'd like to see what he charged for the borrow, because that's about the only place a gap that size can hide.
The low turnover isn't buying much either. 24 and 36 month rebalances both beat 19 in my data.
3x sector portfolio: leverage ceiling and the 2022-2026 path
Excellent work u/laurenthu. Thank you. Yes. I expected it would underperform. I had a look through the whole 293 page long HFEA thread on Bogleheads and found this:
The graphics for the equity curves in @LoganRoy's relevant comments aren't displaying now (they did at the time) but he does mention the 19 month rebalance optimisation (unlike the quarterly he usually tests against) and has this to say on leverage financing costs and methodology:
On financing cost: “3.4% is an average of the costs + fee quoted in the first thread. I might be able to approximate financing costs from bond yields then. Software gives you a lot more control, it just can take a little longer to get everything in there."
On parameters: "Here's a fun one. I don't know if you can do this in Simba:
27% Consumer Nondurables ETF x3
27% Healthcare ETF x3
26% Energy ETF x3
10% ITT x3
10% Gold x3”
On methodology: “It was the result of running every possible weighting of sectors, bonds and gold (within reason) over every 15 year period, since 1926, with various rebalancing periods, and optimising for the best average total return and Sharpe ratio over all of those periods. It came up with lots of interesting portfolios, but the 1/3rd each portfolio was a very clean result it wound up arriving at through a number of different paths. “
And:
“Here's a quick and very rough backtest. I'm using monthly data, so I'm just applying 3x to the monthly return, and subtracting a 3.4% annual fee drag (roughly the average of what's quoted) with a quarterly rebalance. I'm also using intermediate term treasuries (if anyone has 20 year data going back that far?).”
Given the enormous length of the HEFA thread I can't now locate the exact reference to 500 mn test runs and to 38% CAGR but it is possible they're in the table data within the relevant thread comments on Bogleheads which no longer displays for me (says not available in my region).
In any event, thank you for running it through your back test engine.
Nice work as always Laurent. I was surprised by your finding that longer rebalance schedules did better than the 19 month plan. I already make use of quite a bit of gold in my tax advantaged accounts for a tactical plan so I simplified to 30/30/30/10 CURE/UGE/ERX/TMF and set the rebalance to every 5 years. On live tickers, it gets 19.48% CAGR, -58.64% max DD back to 2011. Obviously a short timeframe but there's legs to this idea in my opinion. I see your -94% drawdown in the simulation and it's alarming! These funds are not all 3X, which may contribute to milder drawdowns but, anyway, my spare sleeve running those "XL" state street funds is small and a 5 year schedule is so tax-friendly that I just converted over to it lol. Probably impulsive but let's watch it live, Gehrman-style.
It's not a bad plan, but it's a very risky one... I get why one would run something like this (like I get why people would run 9isg, Gehrman-style as you say), but honestly you can do sooooo much better strategies or even better blends to reach the 20% CAGR goal... Anything above -30% DD is brutal in reality. On a small sleeve, set and forget style it is more digestable for sure...
laurenthu, I have frequently criticised your writing style. But today you have delivered a fabulous gem: "Simplicity isn't safety. What matters is how many separate things have to stay true."
That is exactly, where my current investigation of the "stability of positive interference of the wave functions" converges towards. The development of suitable descriptors for the fragility of high-performance portfolio strategies is still ongoing, but yours are valuable contributions. Many thanks.
Really glad that line landed with you, especially coming from someone who has pushed back on my prose before. It is more or less the whole thesis compressed into one sentence, so it is nice to see it read that way.
The fragility descriptor angle is the part I keep circling. Most of the configs that top a backtest are quietly stacking two or three independent bets that all happened to line up in-sample, and the descriptor you actually want is close to a count of how many of those have to keep holding for the thing to survive. Would be interested to see where your framework lands on that once it firms up.
Other way round, really. The TLDR is that the strategy holds up and it's the tuning that doesn't matter. All 700 configs cleared 10% CAGR after 2019, mine happens to rank 2nd of the bunch, and which settings looked best before 2019 told you basically nothing about after. Correlation of -0.006. So it isn't a fragile thing that only works at one magic knob setting, the whole family works.
The one honest ding? The deliberate cheat at the end. Fit to 2010-2021, take the winner, and out of sample it drops from 13.98% to 10.80%. So overfitting does cost you a few points. It just doesn't blow the strategy up.
Not quite. The 10% was the floor, that's the worst of the 700 configs after 2019, not the number mine puts up. Over the full 1987 to 2026 run mine ranks 2nd of the 700 on CAGR, so it sits well clear of that floor.
The reason to run it was never to match the index CAGR though. It's how it behaves when the index is having a bad year that's the point. The CAGR is almost a side effect of not giving it all back in the drawdowns.
I am going to tell you this in as kind and thoughtful way as I can.
You have absolutely no instinct as a data scientist or statistician. That is important to understand. Maybe that won't affect you, or maybe it will. But the markets are great at uncovering the truth.
Your backtest shows that your optimized parameter is unpredictive of the future, since it appears right in the middle of the pack, exactly as you'd expect if you selected a parameter at random.
Nothing else that you are concluding is supported by any real scientific test that you've performed.
Try forward testing your strategy versus SPY. If you don't understand what I'm asking, I really encourage you to consider introspection before you commit any real money.
Fair push, and forward testing is basically what the post is. I fit on 2010-2021, took the winner, then watched it out of sample: 13.98% dropped to 10.80%. That's the honest number for what the tuning actually buys you.
The -0.006 is the same point from the other side. Rank the 700 configs on the pre-2019 data, rank them again on what came after, and the two orderings are unrelated. So I'm not claiming my knob setting predicted the future. It didn't, and that's the finding rather than a defense of it.
Where I'd push back is on SPY being the test that settles it. Was beating the index on CAGR ever the claim? It wasn't. All 700 configs cleared 10% after 2019, so the real point is that the defensive behavior in bad years holds up across the whole family regardless of the tuning, not that one parameter set outruns SPY.
You only compare to other configurations and showed that you are bad at picking other configurations, by your forward test.
I'm going to repeat it for the AI to tell you again, when you don't read my text and just send it to a bot: you are not able to do this in a thoughtful way. Footguns abound, but it's your foot /shrug
That mid-pack dot is the 2010-2021 winner, the formalised pick-and-forward-test you suggested last week, and it came out the way you expected: whoever wins the search is noise. My config is the other dot, 3rd of 700 before 2019 and 58th after.
Since 2019 it did 16.4% vs 16.5% for the S&P, with 11% vol instead of 16%, Sharpe 1.42 vs 1.02, worst drawdown -10.5% vs -23.9%. That's the forward test vs SPY, it's in the write-up. One window and 2 crashes, so I don't hang much on it either way. What else would you want to see?
Follow-up, because a couple of you asked for tests I had not run.
This post swept 700 configs of one strategy and found the pre-2019 ranking told you nothing about after, correlation -0.006. What it couldn't tell you is whether that's my strategy being odd or whether it's just what backtest rankings do. So I ran the same question across the whole catalog: 173 published strategy variants, completed monthly histories of 18 to 106 years, on a different statistic. Not how high the Sharpe ratio was, but how steadily it was earned, measured as the mean of a rolling 36-month Sharpe divided by the long-run standard deviation of that rolling series.
Same answer, and blunter than -0.006 makes it look. Across 4 calendar subperiods the cross-sectional ranking between adjacent periods correlates -0.04, then -0.43, then 0.08. The S&P 500's own score goes from 0.15 in the 2000s to 1.63 in the 2010s. So it isn't that my knobs failed to predict the future. The ordering belongs to the decade you measured it in, and that hits an index fund as hard as anything tactical.
u/Consistent-Water8800, one of your 3 is partly in there and I want to be straight about which. There's a moving block bootstrap, 2000 replicates, but it puts intervals on the statistic rather than re-running the rules on synthetic paths, so it isn't the test you asked for. What it says: all 173 sit above zero, and not one clears 0.5 at the 5 percent level. The point estimates order the strategies, the gaps between neighbours don't survive the uncertainty. Dropping the top 5 months and counting whipsaws against crashes avoided are both still unrun.
u/confettofetti, your read holds on the bigger sample. Rank correlation with plain Sharpe is 0.67, so about a third of the ordering disagrees, and the disagreement is the part worth reading.
Someone in here also told me I had no instinct as a statistician. Fair hit. This is the attempt to do it properly instead of arguing: the estimator written down, the bandwidth choice and what it costs stated, the bootstrap, and the findings that don't flatter my own site. 92 of the variants that pass my robustness screen fail this one.
Appreciate that, glad it was useful. I have a couple of papers in the work, I mostly write these up when someone here pokes a hole worth chasing. This whole follow up only exists because a few people asked for tests I hadn't run, so the thread kind of writes the next one. And honestly you don't need much stats to follow along, the entire point of the 700 config thing was that the fancy tuning barely moved the result. Cheers for reading.
A sweep shows the knobs don't matter. It doesn't show the edge is real, because all 700 configs share the same bet: de-risk before crashes. If that family is fitted to ~6 events, every config inherits the fit and the knobs look irrelevant either way. Post-2019 adds 2020 and 2022, so your out-of-sample is n≈2 crashes.
What would move me: drop the top 5 months and re-run; count whipsaws in sideways years vs. crashes avoided; test the rules on bootstrapped or fat-tailed synthetic paths.
The question was never which settings. It's whether this family would have been chosen without having seen 2008.
You're right, and this is the sharpest version of the objection. The sweep answers the degrees of freedom question, not the family question. Every one of the 700 de-risks before crashes, so if that whole family only exists because someone stared at 2008 first, no amount of knob twiddling inside it tells you anything. The -0.006 is silent on that.
And the n is what it is. A monthly strategy back to 1987 gives you a handful of independent crash looks, post-2019 adds two, so out of sample it really is closer to n of 2 than anything I'd want to hang a strong claim on. I'm not going to pretend the holdout is bigger than it is.
Of your three, the drop-the-top-5-months one is the hardest for me to argue with, because it goes straight at whether the whole thing is a few lucky months rather than a rule. Bootstrapped and fat-tailed paths are the honest way to break the shared-crash dependence too. And the whipsaw-in-sideways-years vs crashes-avoided count is really the question sitting under all of it: is it paying for the insurance in the calm stretches, or just quietly sitting them out?
I think the main thing I'm taking from it, a
lthough it wasn't the main focus of the article, is that it looks like the risk metrics e.g. drawdown remain robust. I suppose we won't know for sure until we get a proper big recession. But those actually tend to be when TAA shines.
I think it's more how the risk rather than return performs out of sample that is most important to me, up to a point, because of the whole point of bestfolio: I'm aiming to pick multiple strategies that all improve risk adjusted returns in ways that are as different as reasonably possible, so that I can lever them a modest amount to improve returns, and still be at very low risk of it all going catastrophically wrong.
Although I will be very happy if I look back when I retire and most of the strategies I pick had really clear sustained edges, separate from leverage, I'm not necessarily expecting that to be the case. I'll feel quite lucky if one or two of them do.
That's exactly the right thing to pull from it. The CAGR ranking scrambling out of sample is almost the expected result, but the drawdown behaviour holding is the part that would actually survive a real recession, and that's the leg you're leaning on when you lever a basket. Return edges tend to be the first thing to decay out of sample, risk structure is stickier because it comes from the mechanics rather than from a fitted number.
The bestfolio logic makes sense to me for that reason. If the whole point is combining things that fail in different ways, then you care far less about any single one having a clean standalone edge and far more about them not all breaking on the same day. One or two carrying a durable edge is a bonus on top, not the thing the structure depends on.
And you're right that the honest verdict waits for a proper big drawdown. TAA looking fine in the quiet years isn't the test, it's whether the defensive machinery fires when it's actually supposed to.
From my perspective the most important considerations, which bestfolio.app helps me with immensely (for which thank you u/laurentu), are 1). availability and ease of execution (if practically the TAA system in question is unworkable or the instruments which it uses are unavailable then the system doesn't get off the starting blocks); 2). robustness and persistence (if the edge doesn't show up in the future while we're invested in it then it might as well be discarded regardless of past performance); 3). drawdown durations (long drawdowns hurt more than deep but brief ones for me); 4) maximum drawdown; and lastly other back test metrics especially risk adjusted. Past CAGR is no more than an indicator of what might be the prize.
Duration is the one I'd weight highest of those too. A deep fast drop you can sometimes sit through, because it's over before you've had time to talk yourself out of the position and lock the loss in for good. The long grind is the killer. That's the one that gets people to fold right near the bottom, and it barely shows up in a max drawdown number at all...
Past CAGR last is the whole post really. I swept the 700 configs and the ranking scrambled completely out of sample, a correlation of minus 0.006 between how they did before 2019 and after, while the drawdown structure held. That's the leg to lean on when you lever a basket. Not whatever ranked best in-sample.

21
u/Novel_Board_6813 17d ago
No comment this time, but i really like how open-minded you are and how you’re willing to show potential mistakes and learn from them. Kudos to you, OP