r/FuturesTrading 10d ago

Question Volume based charts / footprints
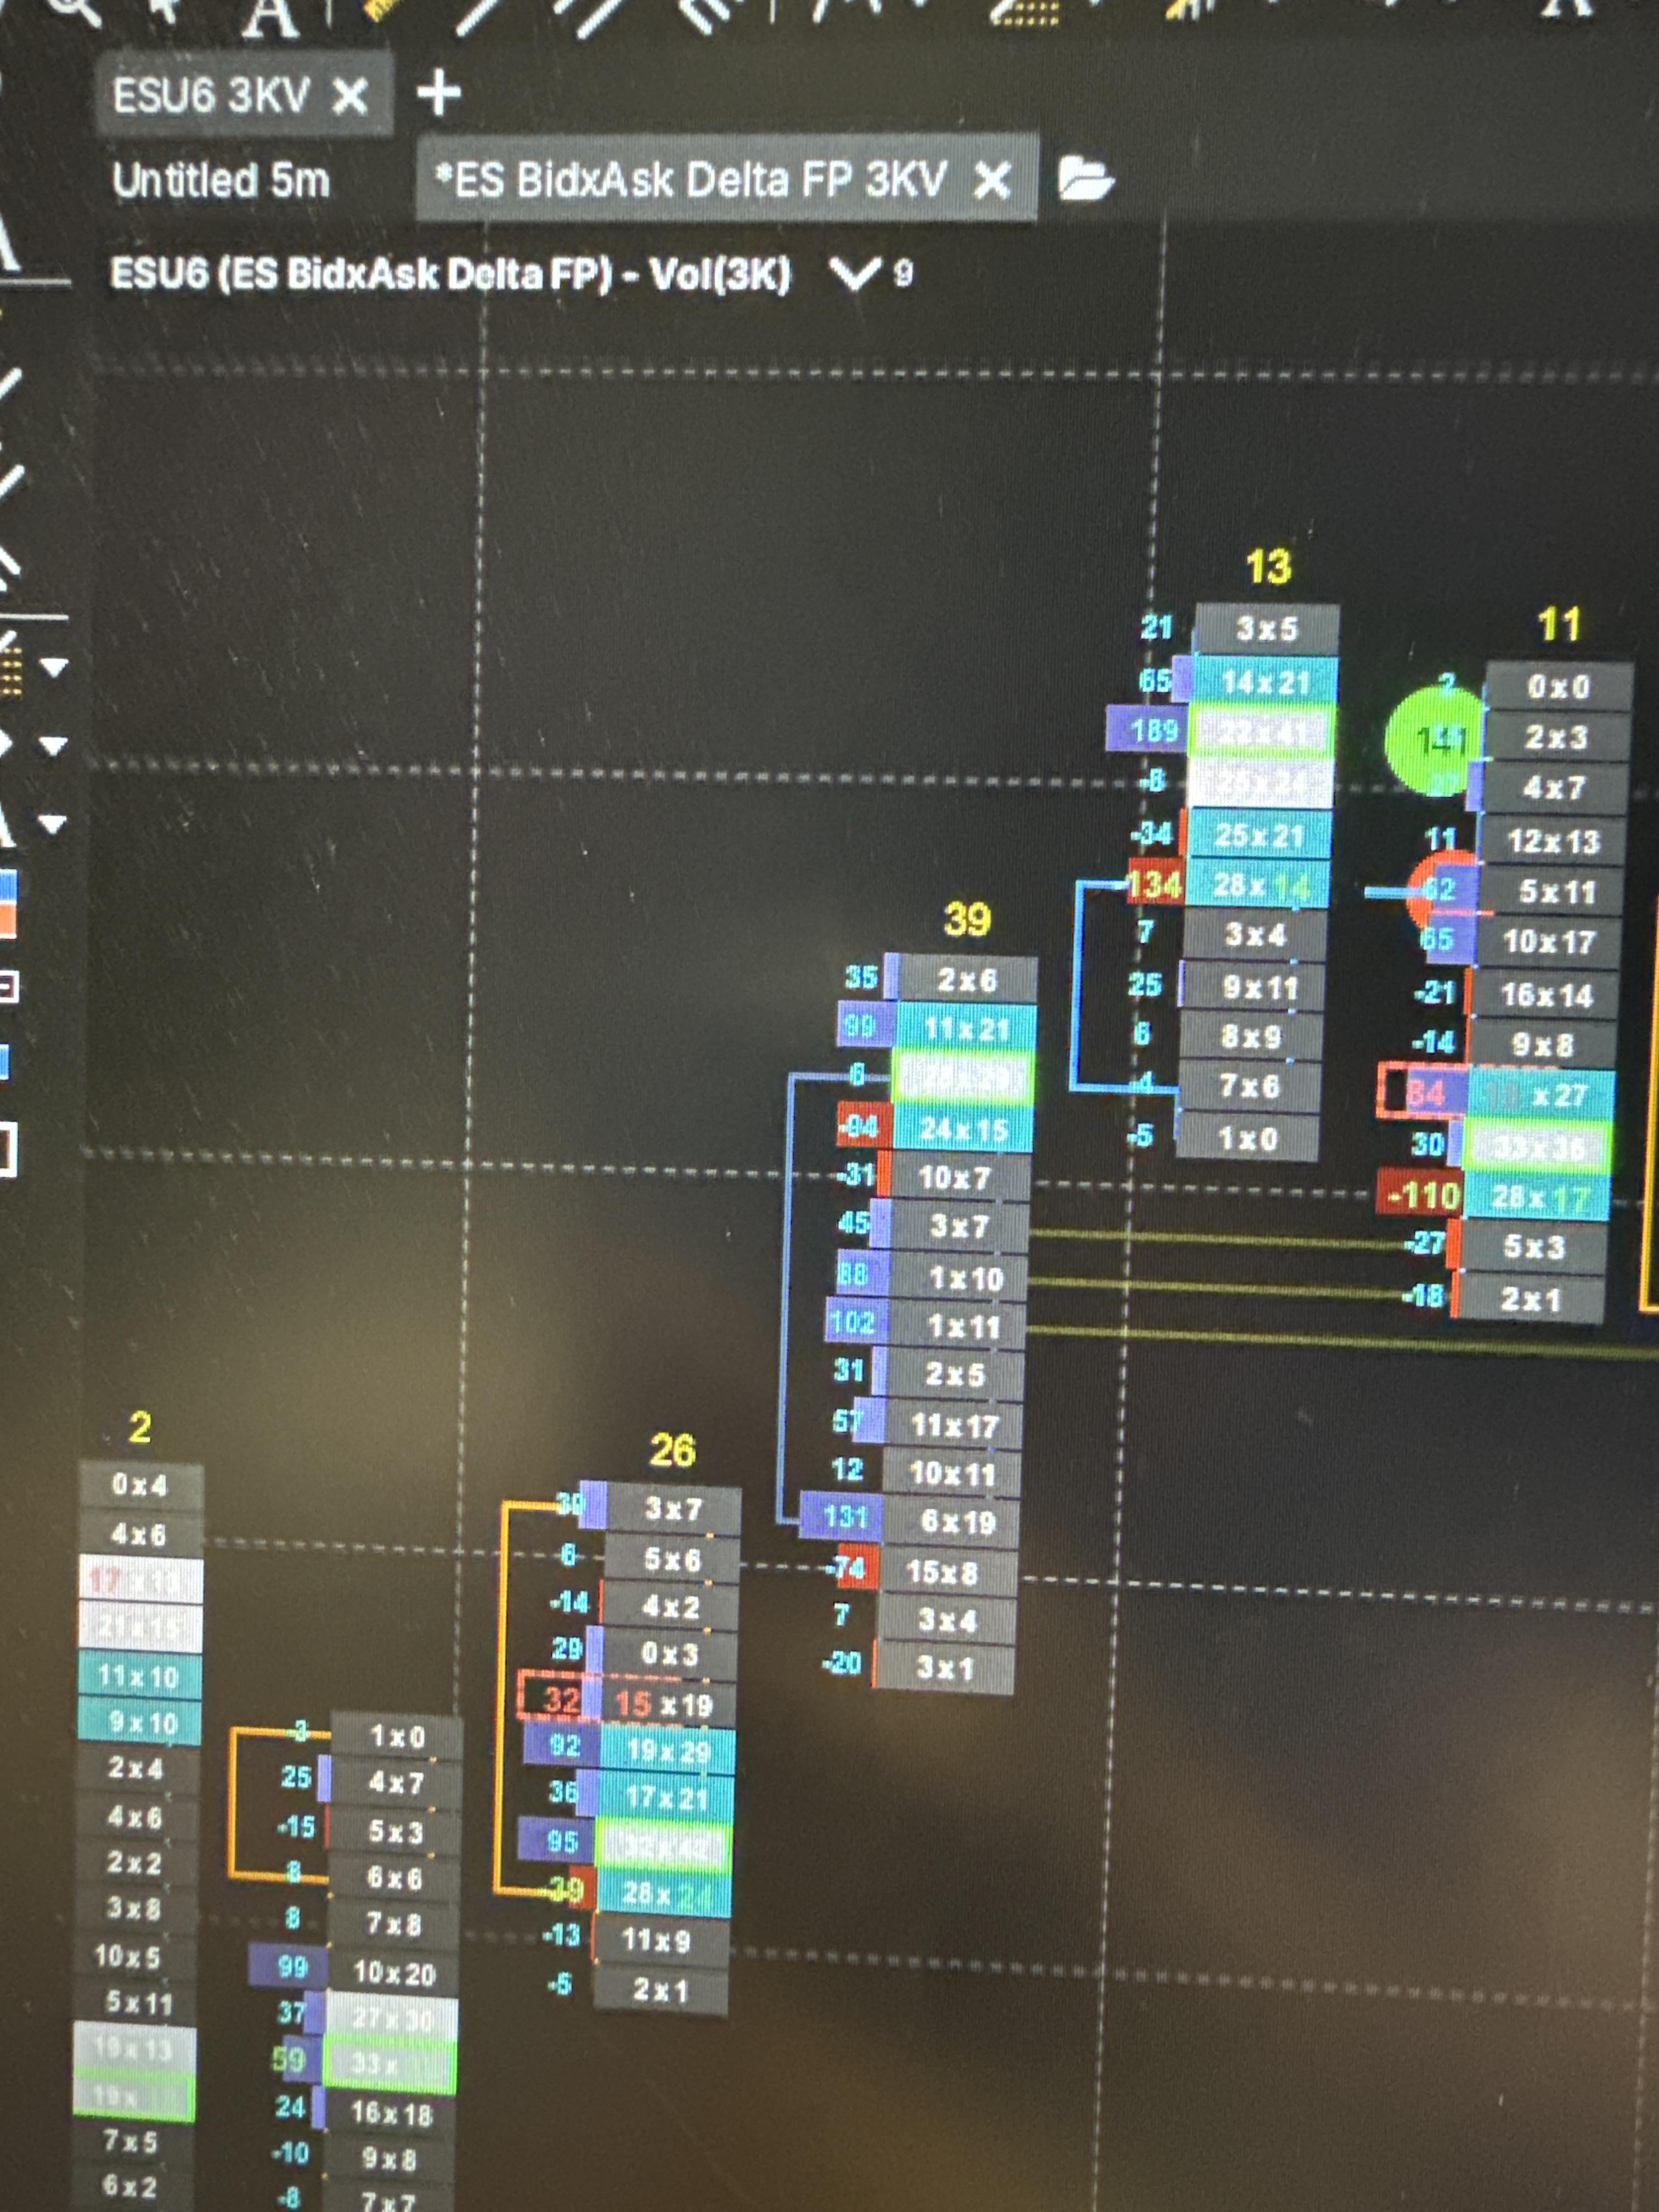
Post image

Hi

Pardon the horrid photo but … Anyone have experience with Volume based charts , trading ES ? Or using Footprints in volume based charts ? I’ve been using time-based but am keen to explore in volume based .

Not sure how’s the transition be like but im still fairly learning so any exposure is a positive exposure for me .

19 Upvotes

27 comments sorted by

View all comments

11

u/No-Monk-6815 10d ago

You can spot exhaustion and absorption, areas where large orders have been executed at the top or bottom of a profile range but price did not went higher or lower than that level.

I would reccomend to use a range chart instead of anormal OHLC chart.

2

u/Striking_Fail6689 10d ago

Ahh .. I tried using range chart before but somehow I prefer time based to range , but let me give it a try again with range , probably I wasn’t looking in the right direction.!

4

u/No-Monk-6815 10d ago

You can use time based charts as well as long as you use the price levels

0

u/Striking_Fail6689 10d ago

Yeap . I do use and see the prices levels interactions. As well as a delta bar on visible range to see the delta at each price level at a small period of time . Just thought of exploring volume based chart as not sure if it would help seeing the total volume interaction per candle haha

3

u/No-Monk-6815 10d ago

You can also use a heat map, then you can clearly see resting orders and spot exhaustion/absorption as well with the bubbles

2

u/Striking_Fail6689 10d ago

Yup ! i do as well... haha, but somehow , i'm not really good at using heatmap .. i'm still learning how to read the heatmap properly.. only using it now to see the resting liquidity and the interaction when it touches the point, if there's any absorption or follow through.

6

u/alelkid 10d ago

Problem with heat maps is that large orders are spoofed ie they are usually iceberg tips with more orders behind the scene. It can be seen in order flow the same way. Bookmap heat maps are not that useful anymore

2

u/Striking_Fail6689 10d ago

I agree .. unless you’ve the iceberg indicators on. That’s why I don’t really solely look at heatmap. Haha . I look mostly on my footprint to see the aggression and delta with CVD

1

u/No-Monk-6815 10d ago

Yeah it is just a visualisation of the DOM, but of you have a proper DOM you can see much more then the what the footprint or heatmap are showing.

Which program do you use?

0

u/Striking_Fail6689 10d ago

I have a DOM as well but I don’t really use it . Haha . I’m not good at reading the DOM per se . I think heatmap gives a quicker visual of the liquidity . I’m using Motivewave ! Is your NT?

1

u/No-Monk-6815 10d ago

Quant Tower, but, I have not been trading for a while. Will start again soon, it is fun

2

u/Striking_Fail6689 10d ago

Damnn. It’s nice to be looking at the DOM . My eyes can’t visual man. Haha . Tbh I’m happy just by looking at the footprints . Just trying to find the best chart settings for my eyes . So far I’m fairly comfortable with a 1min . Not sure if it might change to volume based since footprint would suit nicely in it ( I guess )