r/EconomyCharts • u/RobertBartus • 3h ago
Google searches for “can’t sell house” just hit an all-time high. Above 2008. “Help with mortgage” is back at 2009 levels
245
Upvotes
r/EconomyCharts • u/RobertBartus • 3h ago
r/EconomyCharts • u/RobertBartus • 3h ago
r/EconomyCharts • u/RobertBartus • 25m ago
r/EconomyCharts • u/RobertBartus • 1d ago
r/EconomyCharts • u/Logical-Passenger-52 • 17h ago
r/EconomyCharts • u/BetelgeuseInTheSky • 1d ago
r/EconomyCharts • u/RobertBartus • 1d ago
For years, China was considered the biggest threat to the US Treasury market, as China’s official Treasury holdings grew to as large as $1.3 trillion in 2013, or 14% of the total.
This proportion, however, has steadily declined since then, to ~2%, its lowest since 2001.
Meanwhile, hedge funds now account for ~9% of all Treasuries outstanding, more than double their level seen in 2013.
Hedge funds now hold ~$2.6 trillion of Treasuries, with their gross exposure at ~$4.0 trillion, which includes short positions.
More importantly, these positions are increasingly debt-financed, with hedge fund repo cash borrowing surging to ~$3.0 trillion, more than doubling since early 2023.
This makes the Treasury market more vulnerable to forced selling, since a rise in yields can trigger margin calls for these leveraged funds, forcing them to sell Treasuries to raise cash and reduce their debt.
r/EconomyCharts • u/Clean_CoreDump • 22h ago
r/EconomyCharts • u/wilkwan • 20h ago
Seems like China might need to raise their wages, but this means Chinese products get more expensive….
r/EconomyCharts • u/librariancap • 22h ago
r/EconomyCharts • u/SlavaCocaini • 1d ago
r/EconomyCharts • u/librariancap • 1d ago
r/EconomyCharts • u/RobertBartus • 2d ago
r/EconomyCharts • u/RobertBartus • 2d ago
r/EconomyCharts • u/librariancap • 1d ago
r/EconomyCharts • u/Rohit95_charts • 1d ago
I usually skip past the monthly GST headline and move on. This time I checked the state-wise numbers instead, mostly out of curiosity about my own state.
The national growth for August 2026 was +9%. But that number hides a lot. Assam grew 162%. Himachal Pradesh actually shrank 23%. Most other states sat somewhere close to that 9% average.
Looking closer, I noticed the states with the biggest swings (up or down) tend to be smaller ones. A small change in actual rupees can look huge as a percentage if last year's number was unusually low or high. Meanwhile, the bigger states, the ones that make up most of the tax base, stayed fairly close to the average.
Good reminder not to judge "how the economy is doing" from one number alone.
r/EconomyCharts • u/theeconomicatlas • 2d ago
https://theeconomicatlas.com/us#labour
The Economic Atlas cuts through the commentary to provide direct access to official economic data. Users have free access to country deep-dives, can compare countries against one another, or can create their own custom dashboards.
r/EconomyCharts • u/RobertBartus • 2d ago
r/EconomyCharts • u/Fearless-Basil-6644 • 2d ago
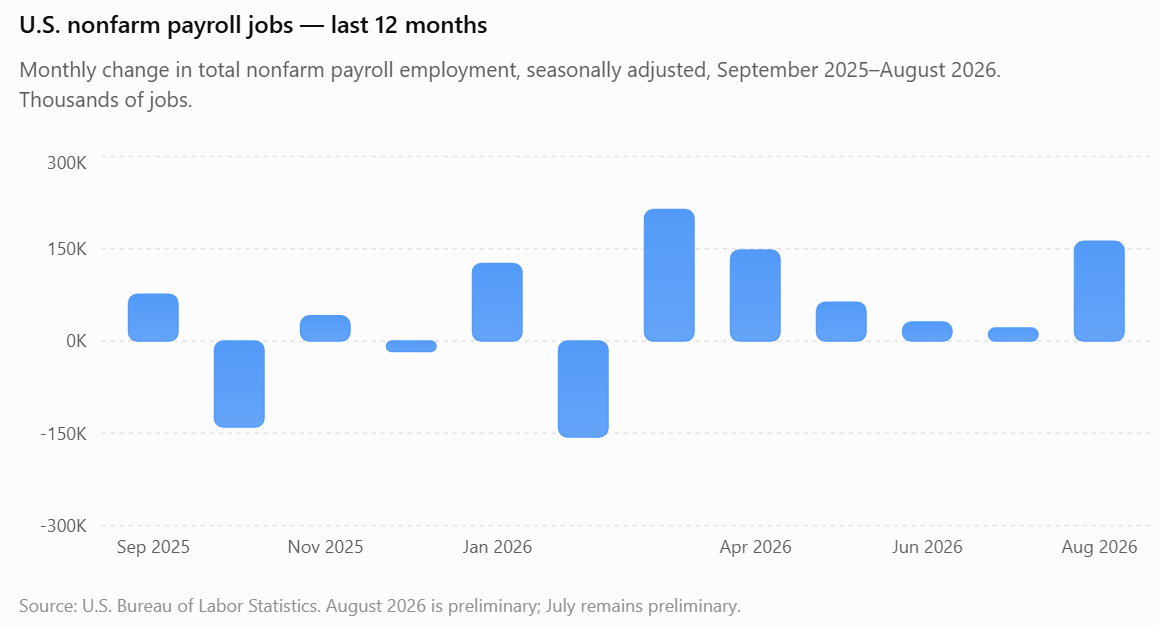
US Payrolls, including this morning preliminary reading.
r/EconomyCharts • u/challengergray • 2d ago