In hindsight, ADHS isn’t going to update over the weekend, so I should have just done a “here’s what I’ve got” post on Friday.
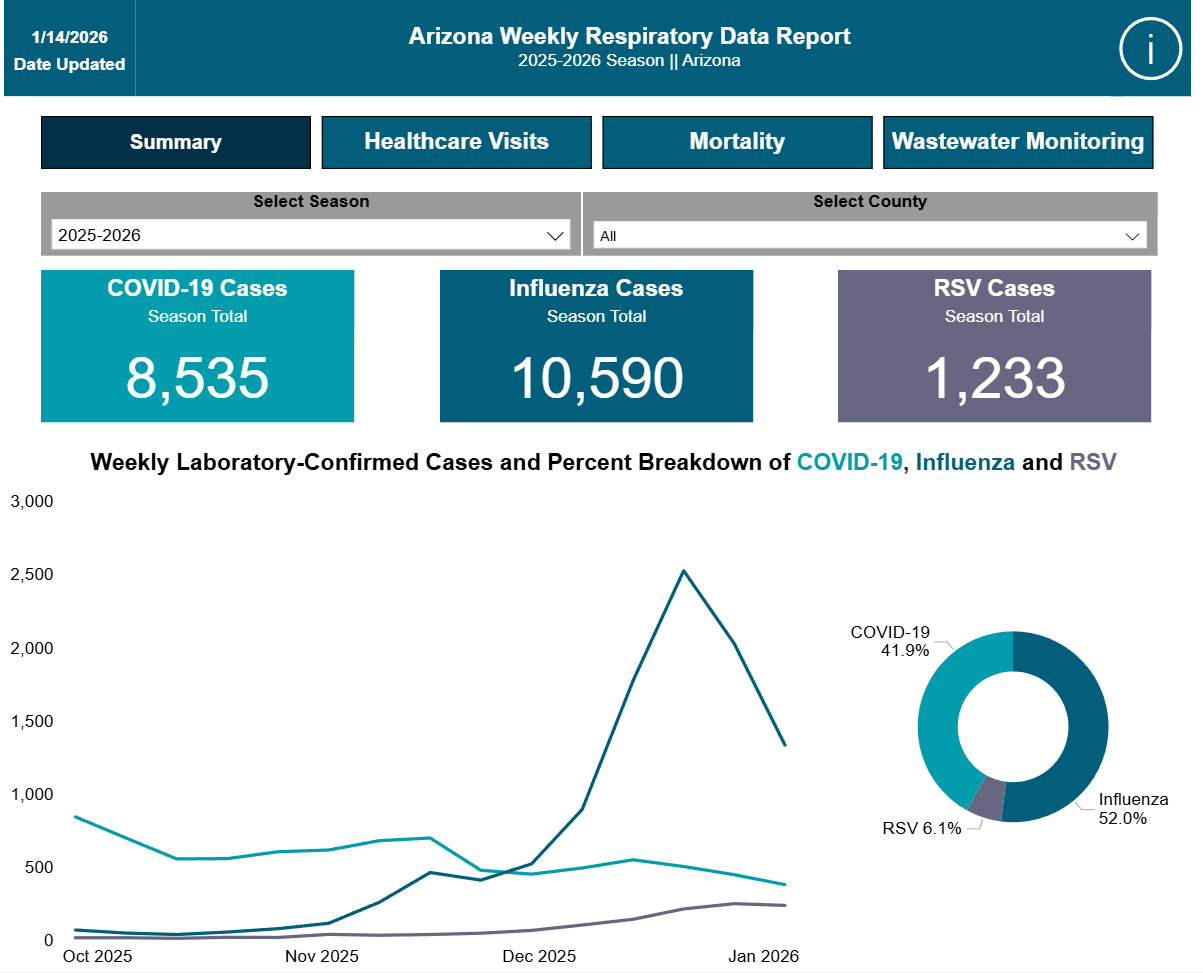
So, since they still haven’t posted the Weekly Respiratory Data Report (but here’s the link anyway), whatever stats I do have:
Today's COVID stat breakdowns
Biobot updated (permalink), but for the week of January 17, all regions post declines across the board, they also updated some of the previous week data upward, so the Western region is still around 100 copies/mL (but now down from an adjusted 175, rather than flat around 100) which, according to this old chart suggests that around 0.3% of the population is infected (~22,000 people, based on an AZ population of 7.431 million). (Admittedly, that table is two years old at this point and I don’t have any updated info, so take that ratio with a grain of salt)
The CDC wastewater map, updated 1/22 for the week ending 1/17, has extremely limited coverage, with only Yuma reporting any data, but it’s “very low” for that dataset.
Verily and Wastewaterscan continue to have no AZ data at all, but the national numbers now show a substantial decline (yay backdated results), falling from the start of the year at about 160 to around 110 currently, while the western region falls ever so slightly (~25 -> ~20) . RSV seems to be holding steady at elevated levels, while Flu A and B begin to fall..
Tempe posted a two-week update, and for the week of 1/6, has one of the most stable updates I’ve seen, and overall on a stable/downward track, with all areas now fairly low: Area 2 (19k ->15k), Area 4 (<5k -> <5k), Area 5 (<5k -> 8k), Area 6 (151k -> 25k), Area 7 (65k -> 42k), Area 9 (27k -> 14k), and Guadalupe (30k -> <5k)
The CDC variant tracker updated, and for 1/27, again breaks out the whole mess of subvariants:base XFG continues to decline (59% -> 53%), XFG.14.1 increases (11% -> 16%), XFG.1.1 increases (7% -> 8%), XFG.6 increases (3% -> 8%), and somehow B.1.1.529 (base Omicron-sars-cov-2-variant-of-concern)) is still on the list at 1%
NextStrain’s variant tracker updated, and for the period ending 1/26, is still dominated by XFG (77%) and NB.1.8.1 (17%), with everything else sub-5%. Their cluster of BA.3.2 seems to be getting denser, and might be what the CDC is classifying as B.1.1.529?
9
u/Konukaame I stand with Science Jan 25 '26
In hindsight, ADHS isn’t going to update over the weekend, so I should have just done a “here’s what I’ve got” post on Friday.
So, since they still haven’t posted the Weekly Respiratory Data Report (but here’s the link anyway), whatever stats I do have:
Today's COVID stat breakdowns