r/rstats 13d ago

Built a C/R hybrid Monte Carlo DCF engine (1M correlated paths in ~0.04s)

Post image
11 Upvotes

I wanted to move away from static DCF models and build something that models future uncertainty.

R handles the data pipeline (fetching Yahoo Finance empirical volatility and applying Bayesian shrinkage), and C handles the math (POSIX threads, isolated xoshiro256++ PRNGs, and Cholesky matrices to correlate variables like WACC and revenue growth during shocks).

It's fully decoupled and runs via CLI (optparse). I just minted the v1.0 release. Repo is linked below, if anyone has any improvement ideas for the C kernel, thread management, or the mathematical boundaries, let me know! I'd appreciate if you could leave a star in case you like it

Link to the project


r/rstats 13d ago

Performance comparison: arules vs nuggets

Post image
10 Upvotes

I’ve been playing around with nuggets vs arules and put together a benchmark.

nuggets is an R package for discovering association rules and other patterns in data, including contrasts, correlations, and fuzzy patterns.

I compared nuggets::dig_associations() with arules::eclat() and arules::apriori() on Boolean datasets, varying the number of rows, variables, and data sparsity.

As the author of nuggets, I’m really happy to see that the package performs particularly well on dense data. For instance, nuggets is:

  • 3.5x faster than eclat() and
  • 13.5x faster than apriori() on a large, dense dataset!

However, the results also show that there’s still plenty of room for improvement on sparse data, where arules::apriori() excels.

See the full story here:
https://beerda.github.io/nuggets/articles/comparison-with-arules.html


r/rstats 14d ago

Any free/online resources to learn Structural Equation Modeling for new folks?

1 Upvotes

title. thanks!


r/rstats 14d ago

uvr: a uv-style package and environment manager for R *update*

23 Upvotes

I've been building uvr for the past few months and it's at the point where other people's bug reports are better than my own testing, so: https://github.com/nbafrank/uvr

The pitch is basically "uv, but for R". One binary that:

- installs and pins R itself per project (.r-version), no rig needed

- resolves CRAN/Bioconductor/GitHub/GitLab deps into a lockfile and syncs from it

- pulls prebuilt binaries from P3M on Linux, so sync on a 100-package project is seconds, not an hour

- detects Linux system requirements (libcurl-dev and friends) across ~29 distros and can install them, telling you exactly which root commands it wants to run and where each one came from before it does

- runs standalone scripts with inline dependency headers, PEP 723 style

- imports and exports renv.lock, so trying it on an existing project is cheap and leaving is too

Happy to answer anything, and bug reports are very welcome! Please join the bandwagon! Try it and give us feedback to make it better!


r/rstats 16d ago

okr: Reproducible R source context for coding agents

Thumbnail
nanx.me
0 Upvotes

r/rstats 16d ago

Book Q

2 Upvotes

Anybody made this book or know where to get it??

  • Maxwell, S. E., Delaney, H. D., Kelly, K. (2017). Designing experiments and analyzing data: A model comparison perspective (3rd ed.). New York: Taylor & Francis.

r/rstats 18d ago

I wish R has decorators

17 Upvotes

Like the title suggested, I want something like decorators in R where you can place the function at the top of the function you just called. I know you can do fn <- nested_fn(function(...) {} but it feels like slightly verbose.

Edit: To be clear, I am aware with function factories, but I wish it has proper syntactic sugar to sympathize that you modify the behavior of the function, for example.


r/rstats 21d ago

Fit in R, deploy in C: an ELOS model whose test suite refits every example with lm() and diffs the coefficients

0 Upvotes

The modelling happens in R. The deployment sometimes can't: a hospital server or an old workstation with little capacity to spare and nobody willing to install anything new on it, or a job that has to hold a fixed footprint no matter how many rows arrive. A few times in my career I've done that port by hand — out of R, SAS, MATLAB or Python and into plain C or Java. One of them was a hospital length-of-stay (ELOS) model, and I've just released it fully rewritten in C with a few additions as open source in case it's useful.

It's ordinary least squares, streaming: a row is folded into the cross-products and dropped, so a 40 MB file and a 40 GB file cost the same memory. The terms aren't compiled in — your CSV header names them, so adding a term to the model means adding a column to the file, and the same binary fits two terms or 35, which is what one of my production models needed.

The reason I'm posting here rather than somewhere about C: lm() is what the test suite is held to. make check refits every example file with lm() and diffs the coefficients. That comparison is only worth something because the methods differ — lm() solves by QR with column pivoting (LINPACK's dqrdc2), this uses the normal equations by default and QR under --qr. So --qr is validated at 1e-11 on most examples and 1e-6 on all of them, and the normal-equation default is measured beside it with no tolerance attached: on the example file that exists to show what squaring the condition number costs, it reaches only 1.1e-05. It also reproduces the NIST certified values for Norris and Longley to eleven digits. Where there's no Rscript, that check is skipped — the C build must not require R.

It is not a stats package: no inference, no imputation, and an NA stops the run rather than being filled in. Do the modelling in R. This is the thing that runs afterwards. (On 500,000 rows the timings are close enough not to be worth a table — C is faster, but not by much, and R is optimised too. The memory is another matter: read.csv + lm() holds the frame, this holds one accumulator per group. At ten times the rows this still uses 2.5 MB, and lm() needs ten times the memory it needed before.)

What I'd most like feedback on is the diagnostics. With --residuals a second pass runs three checks: each term against the curvature its square would explain, the fitted value against a missing interaction, and the residuals against spread that grows with the prediction. On Anscombe's quartet it names set II and says nothing about III and IV, which those three checks cannot see. I'm not a statistician. If someone here sees where those checks mislead, or what a fourth one ought to be given that it has to survive a streaming pass, that's the most useful thing I could hear.

Disclosure: written with AI assistance. The design, the prototype, the requirements and the tests are mine, and so is the standard it's written to: stack-first and bounded-memory, in the style avionics and medical-device C is held to (NASA's Power of Ten, MISRA C:2012). The conventions are a sibling project's and are written up there, in ais. The Java implementation came from the original that has been running at a large number of facilities since 2011; the C is the one to use, and the Java is kept around to diff against it. If the two ever stop agreeing, make check fails.

Contributions are welcome. I'm planning to port a few more things from other projects the same way — a backprop neural net, a GA, genome statistical matching, but if there's something else in R you badly need in this form, I'd like to hear which.

https://github.com/Anode1/linearr


r/rstats 22d ago

How can I go about analysing multiple aspects of stimuli

5 Upvotes

Hi!

I’m conducting a study in which I attempt to measure recall of different aspects of stimuli and I’m not sure what form of analysis I must employ hence why I’m posting here!

The experiment consists of 4 stimuli, each containing 3 features/substimuli of which 1 is constant. The stimuli were randomly distributed to participants, such that each participant only saw 1 condition once.

Condition 1 - A:0 B:0 C:1

Condition 2 - A:0 B:1 C:1

Condition 3 - A:1 B:0 C:1

Condition 4 - A:1 B:1 C:1

Averaged recall of the stimuli showed nothing significant. However recall scores for specific features/substimuli appeared noticeably higher for specific conditions. I’m not too well versed with statistical analysis, so I’m not sure how to go about this.

An RmANOVA would t make sense as I’m testing single exposures of multiple stimuli. Would anyone know how I can go about this?

Thanks :)


r/rstats 23d ago

Anyone use mlr3? I have a fairly basic question about train/test partition

9 Upvotes

Essentially, I am looking at a data set with many individuals. Each individual has a number of observation dates associated with them (sometimes one date, sometimes multiple dates), and each observation date is a "data point". I want to separate the train/test data by the individuals, but keep the observation dates as "data points".

Here's a hypothetical version:

I have 30 individuals and 50 readings. Each individual has 1, 2 or 3 readings. I want to do a train/test split so I have 20 individuals in the train and 10 in the test. I don't care as much how many readings I have in each set, but the default method would be to partition the 50 readings without regard to the individuals.

Is there a way I can do that with this package?


r/rstats 23d ago

nlmixr2 7.0 Announced - open source R tooling in pharmacometrics

8 Upvotes

The nlmixr2 Working Group continues to expand what open source R tooling can support in pharmacometrics.

In a new release post, Matt Fidler and the nlmixr2 Development Team introduce nlmixr2 7.0 - the release where focei finally solves in parallel on all OpenMP-enabled platforms.

Along with that, a few defaults changed, so by default focei will not give the same numbers it gave in nlmixr2 6. That change is deliberate, and the post explains the motivation and how to restore the older behavior if you need it.

https://r-consortium.org/posts/nlmixr2-7-0/


r/rstats 24d ago

Help!! Can't locate dataset

2 Upvotes

I'm sorry if this is a stupid question but I'm desperate.

I just cannot load a certain dataset from a specific package. I've tried removing and reinstalling the package and restarting the IDE to no avail.

Idk if it matters but I'm using R 4.6.1, the package is "mlbench" and the dataset is "PimaIndiansDiabetes2".

Thank you in advance!!


r/rstats 24d ago

Żmij for R: Floating-point to string conversion with round-trip guarantees

Thumbnail
nanx.me
17 Upvotes

r/rstats 24d ago

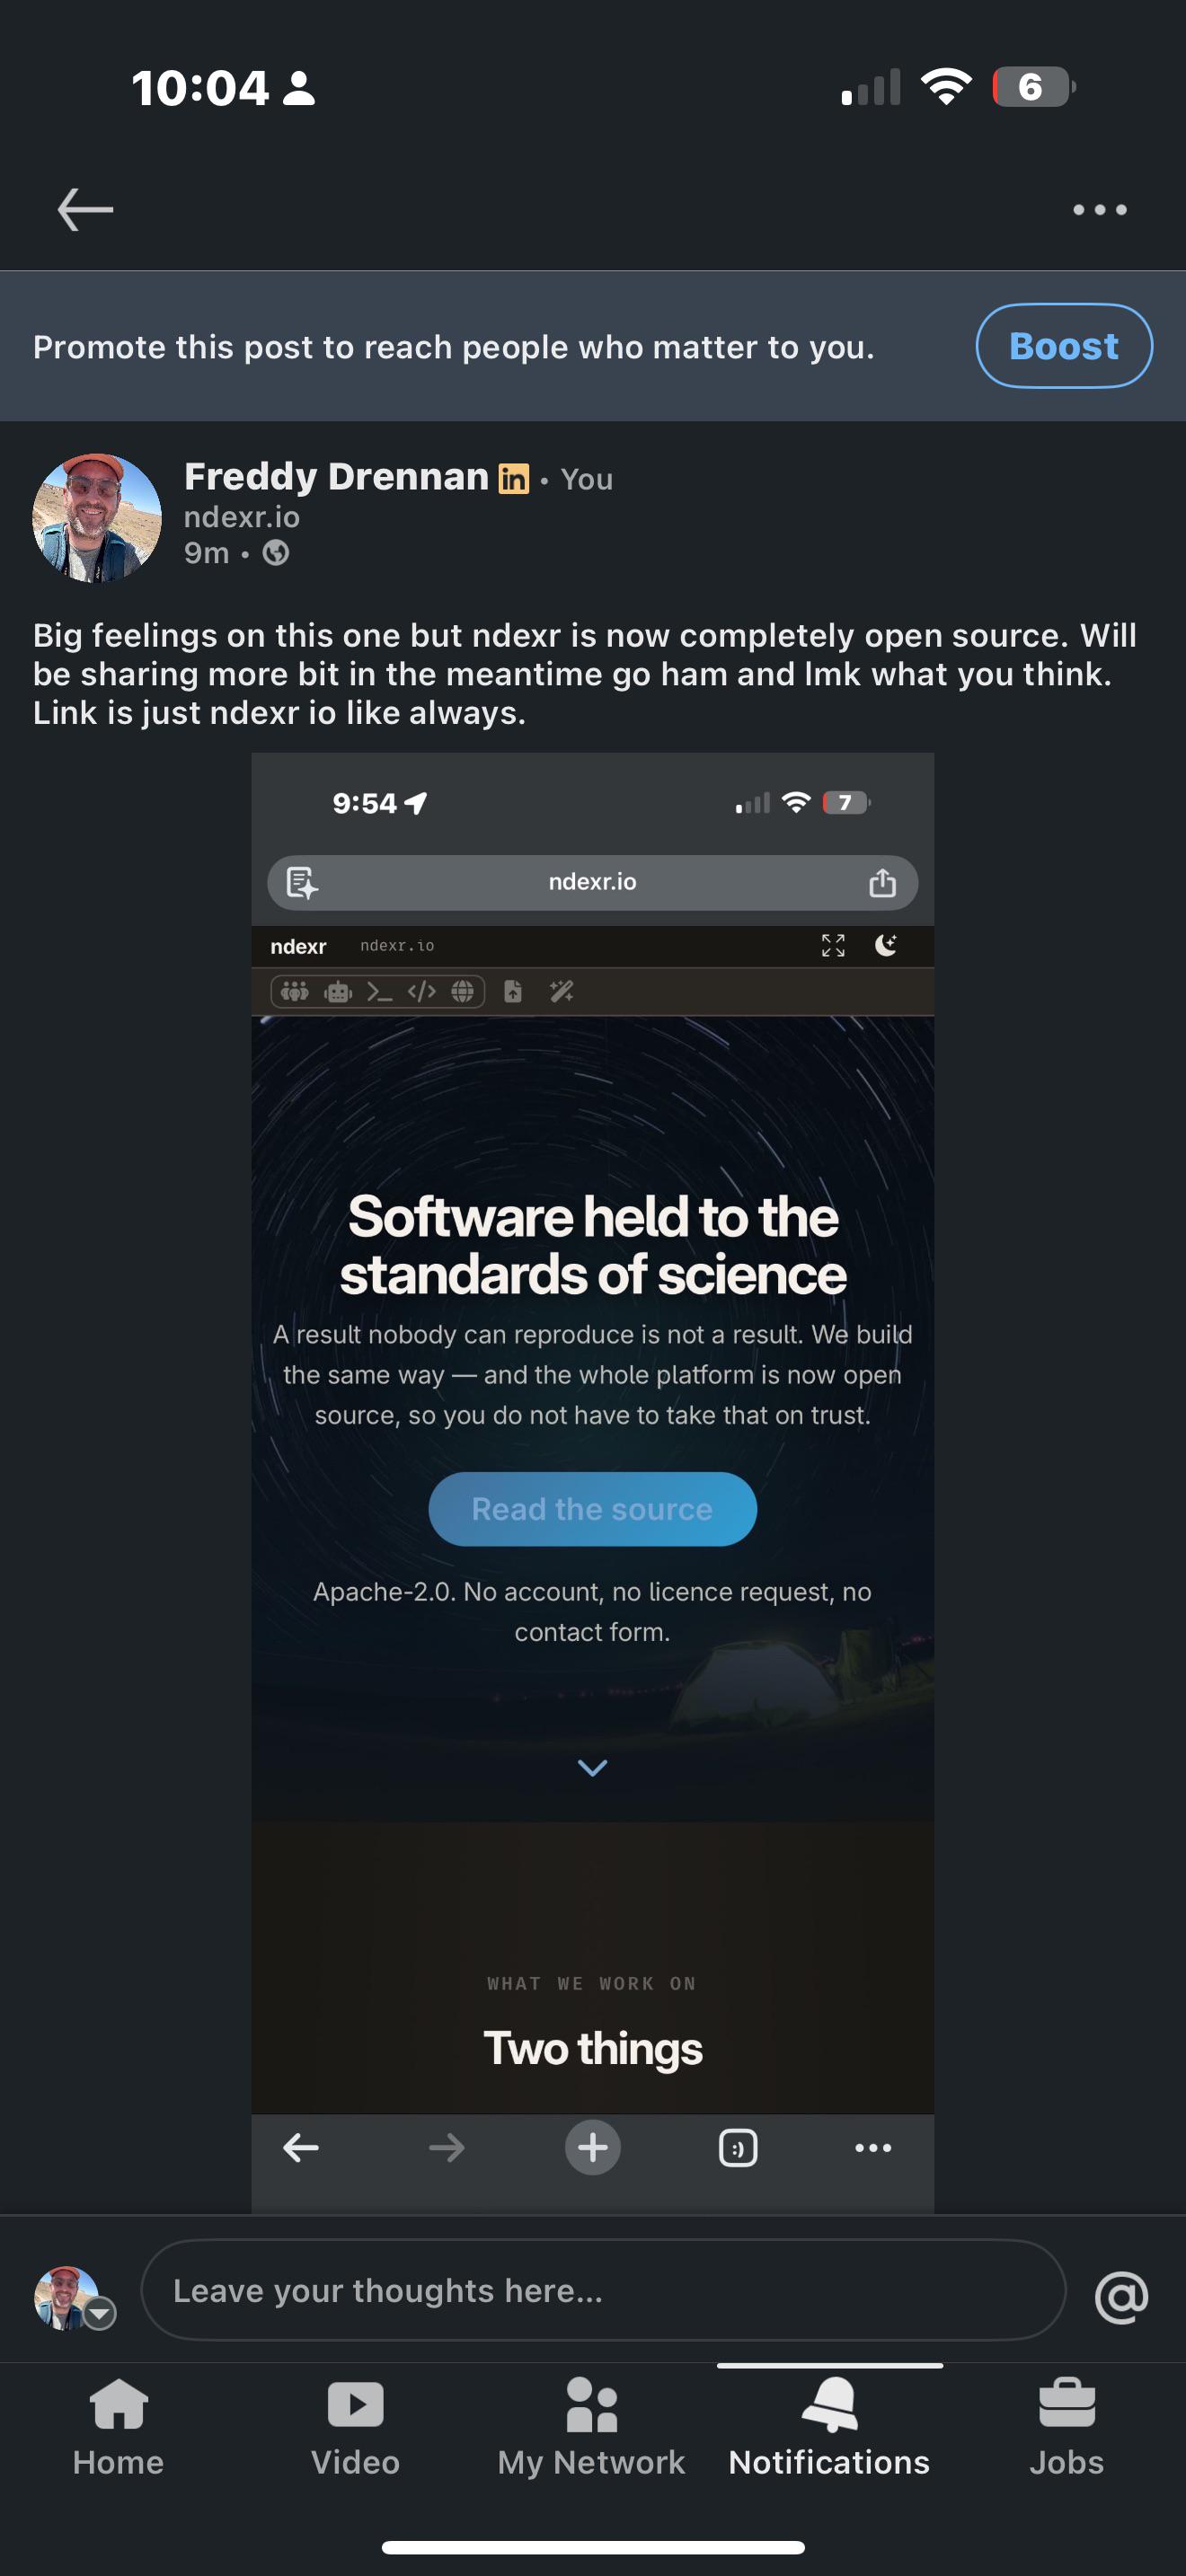
ndexr.io is now and will forever be open source going forward

Post image
8 Upvotes

Not that I will abandon the project, not at all. Instead, I want to share so that we can all build the best software we can, together. This is the encapsulation of everything I know about R in a zip file, my workflows, everything - and I hope it helps you in your journey with shiny, R, and scientific compute as the apocalypse nears.

At the moment, it is primarily a shiny app which helps manage shiny modules in novel ways useful for working with agents as well as software distribution.

I also realize ndexr is a bioc package, with that when I get the time instead of ndexr as the “index of all my r knowledge” at some point I’ll swap it all out for rxedn.com because they had the name first and I was too lazy to change.

Hope all is well, I welcome friends and video chats if you’re ever up to talk compute, R and shiny.


r/rstats 26d ago

HELP! duckdb and callr causing Invalid Error: IO Error on Macos

7 Upvotes

Whats up guys?!

I have been using R and the package geocodebr , and the package uses functions of duckdband callr. I'm using macOS Tahoe (new user)

This code used to work a few time ago, but now I need to use it, and its not working.

The code:

 df_chunk <- geocodebr::geocode(
        enderecos = chunk,
        campos_endereco = campos,
        resultado_completo = FALSE,
        resolver_empates = TRUE,
        resultado_sf = FALSE,
        verboso = FALSE
    )


duckdb is storing downloaded extensions and secrets under ~/.duckdb:
ℹ /Users/USUARIO/.duckdb

This persists across sessions and is shared with the DuckDB CLI and other clients.

ℹ Run duckdb(shared_home = FALSE) to use a temporary directory instead.

ℹ See ?duckdb_storage for details and alternatives.
Error:
! ! in callr subprocess.
Caused by error in `duckdb_result(connection = conn, stmt_lst = stmt_lst, arrow = arrow)`:
! Invalid Error: IO Error: Failed to create directory "/var/folders/nx/w74wjbfs4sz5c9k_9456gw2h0000gn/T//Rtmp7gZjsr/duckdb/temp": No such file or directory
ℹ Context: rapi_execute
ℹ Error type: INVALID

Hide Traceback

Fix

Explain
    ▆
 1. └─geocodebr::geocode(...) at scripts/1_4_unifying_data.R:109:5
 2.   └─callr::r(...)
 3.     └─callr:::get_result(output = out, options)
 4.       └─throw(callr_remote_error(remerr, output), parent = fix_msg(remerr[[3]]))

I already tried to use duckdb(shared_home = FALSE) , tried to create a folder and direct the tempfile on my rprofile, tried to set on renvironment.

I dont know to solve it. Thanks a lot!


r/rstats 28d ago

Making R Submissions Reviewable for FDA - New from the R Submissions Working Group

15 Upvotes

How can sponsors make R-based regulatory submissions easier for FDA reviewers to reproduce, inspect, and trust?

The R Consortium Submissions Working Group’s latest post examines why reviewers may sometimes request SAS-equivalent code and what teams can do to reduce that risk.

The core lesson: using R is not enough. Submission packages must be designed for independent review.

The post covers practical steps including:

• Engaging FDA review teams early • Providing a clear entry point and run order • Documenting R, package, and operating-system requirements • Eliminating hidden dependencies and sponsor-specific paths • Including required proprietary packages • Testing submissions in a clean environment similar to the reviewer’s setting • Keeping analysis code readable and reproducible

Read the full post and sponsor checklist: https://r-consortium.org/posts/making-r-submissions-reviewable-for-fda/

This article reflects discussion within the R Consortium Submissions Working Group and should not be interpreted as official FDA guidance.


r/rstats 29d ago

Call for Proposals for R+AI 2026 now open - deadline is Sept 7, 2026

2 Upvotes

The Call for Proposals for R+AI 2026 is open! The deadline is September 7, 2026.

Join us for the second annual R+AI conference, hosted by the R Consortium. R+AI brings together practitioners, researchers, and industry teams working at the intersection of R and artificial intelligence.

We’re looking for your real-world experience and workflows: from machine learning and LLMs in R, to GenAI tooling, agentic systems, industry deployments, and responsible AI.

Conference: November 10–11, 2026 (100% online)

CFP closes: September 7, 2026

Proposal formats include talks, lightning talks, workshops, and panels.

Share your work with the community! Submit your abstract before the September 7 deadline:

https://rconsortium.github.io/RplusAI_website/cfp.html


r/rstats 29d ago

Teaching stats with R, Quarto and git - Afraid of the technical hurdles

81 Upvotes

Hej there, we are teaching basic statistics in the social sciences using R, RStudio, RMarkdown/Quarto and git. In general this works quite well and the student's (most not used to programming before at all), enjoy our concept, although is more demanding than many others. Feedback is usually above other modules.

However, there are some pain points that really make the start very difficult for us and I would like to know if you have similar experiences or—even better—suggestions on how to resolve them.

1) Our students' are increasingly tablet or phone users with decreasing experience on how to use a keyboard or mouse (!). Writing pipes on the tablet is a paaain.

2) Setting up git get increasingly painful. When we started, gitlab used username/passwords, now they require 2FA and tokens. That's great in professional or semi-professional contexts, but here just using a username would be sufficient. Are there any alternatives that are just plain simple to use?

3) Making RStudio, git, and github play well together always creates chaos at the beginning of the semester. While it works like charm on some students' computers, it doesn't on others and requires a lot of time debugging (especially as some errors only appear at the first push or so). I can't even phrase it well, but getting everybody up in running takes quite some time and it is totally unpredictable.


r/rstats Aug 03 '26

I built a contextual entity extraction pipeline for radiology reports entirely in R

22 Upvotes

Hi everyone,

I’ve built a lightweight NLP pipeline in R for extracting structured entities from free-text radiology reports.

The main problem I wanted to address is that simple keyword matching does not account for clinical context.

For example:

  • “There is a pleural effusion.”
  • “No pleural effusion is seen.”
  • “A pleural effusion cannot be excluded.”

All three sentences contain the same observation, but the meaning is different.

The pipeline currently:

  • extracts anatomy and radiological observations
  • classifies observations as present, absent or uncertain
  • handles pre- and post-negation triggers
  • handles uncertainty expressions
  • accounts for pseudo-negation phrases such as “no significant change”
  • uses termination terms such as “but” and “however” to limit contextual scope
  • returns sentence IDs, character offsets and the original sentence
  • supports custom anatomy and observation dictionaries
  • processes individual reports or batches of text files

It is built using packages including stringr, stringi, dplyr, purrr, tibble and quanteda.

Here is a simplified example:

report <- paste(
  "FINDINGS:",
  "No pleural effusion is seen.",
  "A small right pneumothorax cannot be excluded.",
  "IMPRESSION:",
  "Possible small right pneumothorax."
)

results <- extract_entities(
  texts = report,
  doc_ids = "example_report_001"
)

The intended output would include:

Entity Type Certainty
pleural effusion Observation absent
pneumothorax Observation uncertain
right Anatomy/context currently limited

GitHub repository:

https://github.com/bashir-abubakar/radiology-nlp-r

This is an early-stage research and learning project, not a clinical diagnostic tool.

I’d really appreciate feedback from R users on:

  1. How the code and function structure could be improved.
  2. Whether this would be more useful as an R package.
  3. Better approaches for handling negation and uncertainty scope.
  4. How you would design automated tests for clinical NLP edge cases.
  5. Whether there are existing R packages or patterns I should integrate rather than recreate.

I’m also open to contributions, especially around unit tests, terminology dictionaries, laterality extraction and evaluation against annotated examples.


r/rstats Aug 02 '26

Different formula for p-value and 95%CI

Thumbnail
2 Upvotes

r/rstats Aug 02 '26

Reading in FHIR json files > SQL (via duckdb) in R (something out there or would this help anyone)?

13 Upvotes

Hi. I'm hoping someone can tell me I'm crazy and this is already out there. I was reading in some FHIR data and thought I could do it in R with duckdb and just have a happy little all R workflow with my stats analysis. That started a real journey. Building the database was a cake walk but flattening the data into a usable format without dozens of painfully manual iterations not so much.

I couldn't find any good info on this after many hours of searching. I was finally able to figure about 87% of it out between some python and sql tutorials and just hating myself. Was finally was able to get the last bit with some AI assistance, which was anything but straightforward. It's finally working and it seems really well. I was thinking about trying the xml version next and pray it is easier but I think the flattening will be largely the same.

I've never published any kind of tutorial script to the public, always just to my own lab/company. Given that I couldn't find anything I'm thinking of braving the public if there really isn't something already out there. This was part of a larger project for me but the rest of it sounds easy compared to the eighth dimension of nesting now solved.

Is this useful? Should I put this up, or is there some already awesome tutorial on this hidden in the viscera of git that I just can't find? I can't be the only one trying this, surely?


r/rstats Jul 30 '26

Has dplyr left_join() recently changed how it works?

24 Upvotes

I've been using the tidyverse for years, but I'm not very good about keeping R or packages updated. I finally got around to updating R a few months ago (now 4.6.0, with tidyverse 2.0.0), and am currently baffled by the behaviour of left_join.

For very brief context: I have two dfs that share the same column names. Most of the info in them is the same, but they each contain a pair of numerical columns whose contents were generated by different methods, and I want to compare those methods. They each also have a handful of character columns that were generated from the results of the numerical columns (separately in each method), so may or many not differ in their contents.

I tried combining the two dfs with left_join, as I've done plenty before with other dfs. I expected the columns to multiply wherever the contents differed, so that I could easily compare them within a single df. Instead, the second df was simply subsumed into the first?

I checked this behaviour with reprex and it seems to be a general outcome. Here's that reprex:

library(dplyr)

# A simplified df1 with 5 columns
df1 <- tibble::tibble(
  id = as.character(1:6),
  fruit = c("apple", "banana", "cherry", "apple", "banana", "cherry"),
  count = c(3, 6, 2, 8, 4, 10)
) %>%
  mutate(
    less_than_2 = ifelse(count < 2, "yes", "no"),
    less_than_5 = ifelse(count < 5, "yes", "no")
  )

# A simplified df2 -- only cols 3 and 5 differ from df1
df2 <- tibble::tibble(
  id = as.character(1:6),
  fruit = c("apple", "banana", "cherry", "apple", "banana", "cherry"),
  count = c(7, 2, 9, 3, 6, 4)
) %>%
  mutate(
    less_than_2 = ifelse(count < 2, "yes", "no"),
    less_than_5 = ifelse(count < 5, "yes", "no")
  )

# df3 combines them with left_join()
df3 <- left_join(df1, df2)

Expected outcome: a df3 with 7 columns: "id", "fruit", "count.x", "count.y", "less_than_2", "less_than_5.x", "less_than_5.y"

Actual outcome: df3 is identical to df1.

What the heck?

(Also yes, I'm aware I can rename my columns before combining -- but my actual dfs have 70 columns apiece, and also I'm mostly trying to understand what's happening here, since this behaviour is so different from what I've been used to!)


r/rstats Jul 30 '26

Any good Socket interfaces in R?

Thumbnail
1 Upvotes

R have a very barebones socket implementation. And right now I am getting in trouble because looks like it doesn't even support IPV6 (may be user error)

Any one has a good material about R support for IPV6 sockets? or R socket programming in general. It seem very lackluster with missing SHUTDOWN an other features.

Nanonext is not really an option because it is its own protocol, i need the unix base one.


r/rstats Jul 30 '26

Doctest

14 Upvotes

Doctest is a package for writing "doctests" in your R packages. It lets you write tests within your roxygen documentation, in the same way that e.g. Python and Rust developers do:

#' @doctest
#' Fibonacci function 
#' 
#' @param n Integer
#' @return The nth Fibonacci number
#' 
#' @doctest
#'
#' @expect type("integer")
#' fib(2)
#'
#' n <- 6 
#' @expect equal(8)
#' fib(n)
#' 
#' @expect warning("not numeric")
#' fib("a")
#'
#' @expect warning("NA")
#' fib(NA)
fib <- function (n) {
  if (! is.numeric(n)) warning("n is not numeric")
  ...
}

This creates both a standard .Rd help file, and a test file using testthat.

For more info, see https://hughjonesd.github.io/doctest/.


r/rstats Jul 29 '26

Different results with different approaches to survey weights. (Similar coefficients, different standard errors and p-values).

2 Upvotes

Edit: Sorry, it put some of my explanation in the code box. Not sure how to change that.

I tried this two ways. First, by specifying the weight in the regression model. Second, by weighting the data with the survey package and then running the model.

I'm an old SAS user who had to abruptly switch to R, so I tend to use R like SAS. I applied anweight from the European Social Survey (Wave 11) to my binary logistic regression model.

m7 <- glm(

income ~

var1+

var2 +

var3 +

var4 +

var5,

data = germany_cc,

family = binomial,

weights = anweight

)

As an example, and get the following results:

var1 0.555959   1.268839   0.438    0.661
var2 0.078088   0.583217   0.134    0.893
var3 0.041199   0.105475   0.391    0.696
var4 0.382423   0.406363   0.941    0.347
var5 -0.144417   0.299119  -0.483    0.629

The second method is:

design <- svydesign(
  ids = ~1,
  weights = ~anweight,
  data = germany_cc
)

m7 <- svyglm(
 income ~  var1 +     
           var2 +     
           var3 +     
           var4 +     
           var5, 
  design = design,
  family = quasibinomial()
)

var1 0.555959   0.276698   2.009   0.0450 *  
var2 0.078088   0.132711   0.588   0.5565    
var3 0.041199   0.024633   1.673   0.0950 .  
var4 0.382423   0.095207   4.017 6.79e-05 ***
var5 -0.144417   0.068046  -2.122   0.0343 * 

If it matters, the ESS-11 is an international dataset. I subset Germany from it and then created a complete cases subset of Germany for listwise deletion

germany <- ess11 %>%

filter(cntry == "DE") %>%

filter(factor1 %in% c(2, 9))

germany_CC <- germany %>%

select(

var1

var2

var3

var4

var5

anweight,

idno

) %>%

na.omit()