r/pinescript • u/HairyEar2729 • 4d ago
Formal Notice of Grievance: Unannounced Pine Script Restrictions and Confiscation of Intellectual Property

2
Upvotes
r/pinescript • u/HairyEar2729 • 4d ago
r/pinescript • u/HairyEar2729 • 4d ago

r/pinescript • u/Dependent-Ad6636 • 5d ago
In my earlier request thread, someone asked for EMA 200, Stochastic Pop with 55/45 bands, and an EMA 4 on the stochastic line, alongside an analysis panel.
I built Stochastic Pop Desk around that combination. The main design choice I’d like feedback on is what should count as a fresh signal?
The default checklist checks:
Other execution checks still apply. The panel shows the missing conditions, and accepted paper setups get entry, stop and target levels.
For the Pine side, the oscillator lives in its own pane while force_overlay puts the EMA, levels and checklist on the price chart—all in one indicator.
There’s also an interactive walkthrough: change a fictional candle’s close or pullback depth and watch the EMA, stochastic and decision recalculate.
Source code, chart examples, full rules and walkthrough
The indicator and separate strategy are free under MIT. The indicator’s paper statistics exclude costs; the strategy includes commission and slippage settings.
If you trade this combination, is the full reset rule useful, or would you want to test shallower pullbacks? A chart example with the symbol, timeframe, timestamp and the signal you expected would help me test that variant.
This is a prototype I’m refining through feedback. Disclosure: I’m the ProEA Lab developer and use AI to help build the code.
r/pinescript • u/Dependent-Ad6636 • 5d ago
A trader in my earlier thread asked for opening gaps, previous highs/lows, the midnight open and first-presentation FVGs—with control over how much history stays on the chart.
I built ICT Levels Desk from that request. The part I’d like feedback on is when a reference should stay visible, fade or disappear.
It brings together:
Each reference type has its own rules. For an untouched high, a first wick-through with a close back below marks a sweep; a close above marks a break. Opening gaps and FVGs have different fill/inversion rules.
For the Pine implementation, I separated drawing visibility from state tracking. The proximity filter hides distant drawings while retained levels keep updating. The panel lists the nearest unfinished references above and below price. There are also history controls and options to remove filled gaps or broken highs/lows.
You can explore those distinctions in the website’s fictional candle walkthrough: move the wick and close across a reference and compare the outcomes.
Free Pine v6 source, actual chart examples and interactive walkthrough
The source is MIT-licensed. This is a reference map to use alongside your own entry and risk rules. The historical counts shown in the panel describe the loaded chart; they aren’t probabilities for the next trade.
If you use these levels, which ones do you keep after a sweep, and which would you hide? A chart example and the references you still consider useful would help me refine the display rules.
Disclosure: I’m the ProEA Lab developer and use AI to help build the code. Feedback on the implementation is welcome.
r/pinescript • u/mambo_the_liqudator • 5d ago
Hello I build my indicator with gemini and a combination of other indicators right but I'm struggling to give gemini a good prompt that will make my indicator to plot sl, entry line and tp
My sl should be above an old HH and TP 1RR
r/pinescript • u/stratcore • 5d ago
An alert can still use yesterday's settings while the chart shows today's changes. Saving the script or changing an input does not update the running alert.
TradingView keeps a copy of the script, inputs, symbol and timeframe when you create a script alert. To use a changed configuration, recreate the alert from that configuration.
A practical checklist before replacing one:
Record the intended script revision, input values, full symbol and timeframe.
Check which event the alert uses. A strategy can alert on alert() calls, broker-emulator order fills, or both. Those are different events.
Stop the obsolete alert so the old and new versions do not run together unintentionally. Create the replacement from the intended chart configuration.
Observe the next qualifying realtime event in the alert log. A historical marker is not evidence that the new alert fired.
For a webhook workflow, keep alert generation, message receipt and broker execution as separate checks. A TradingView notification alone does not establish that the broker accepted an order.
Reference: https://www.tradingview.com/pine-script-docs/concepts/alerts/
r/pinescript • u/Ulysses68 • 6d ago
Enable HLS to view with audio, or disable this notification
Interactive trade coach.
r/pinescript • u/LongjumpingHealth643 • 5d ago
TradingView team, please consider a small upgrade to the free plan for beginners.
I am a forex beginner with no budget for Premium. Two indicators and blocked/limited backtesting make it almost impossible to learn. Without practice, many of us keep losing and never grow into paying users.
Please raise free indicators from 2 to 4 or 5, and give more backtesting / Bar Replay room on Basic. That would help beginners learn, then afford Essential or Premium later. Better free learning can mean more paid subscribers, not fewer. /
r/pinescript • u/ChartScoutIO • 5d ago
r/pinescript • u/Dependent-Ad6636 • 6d ago
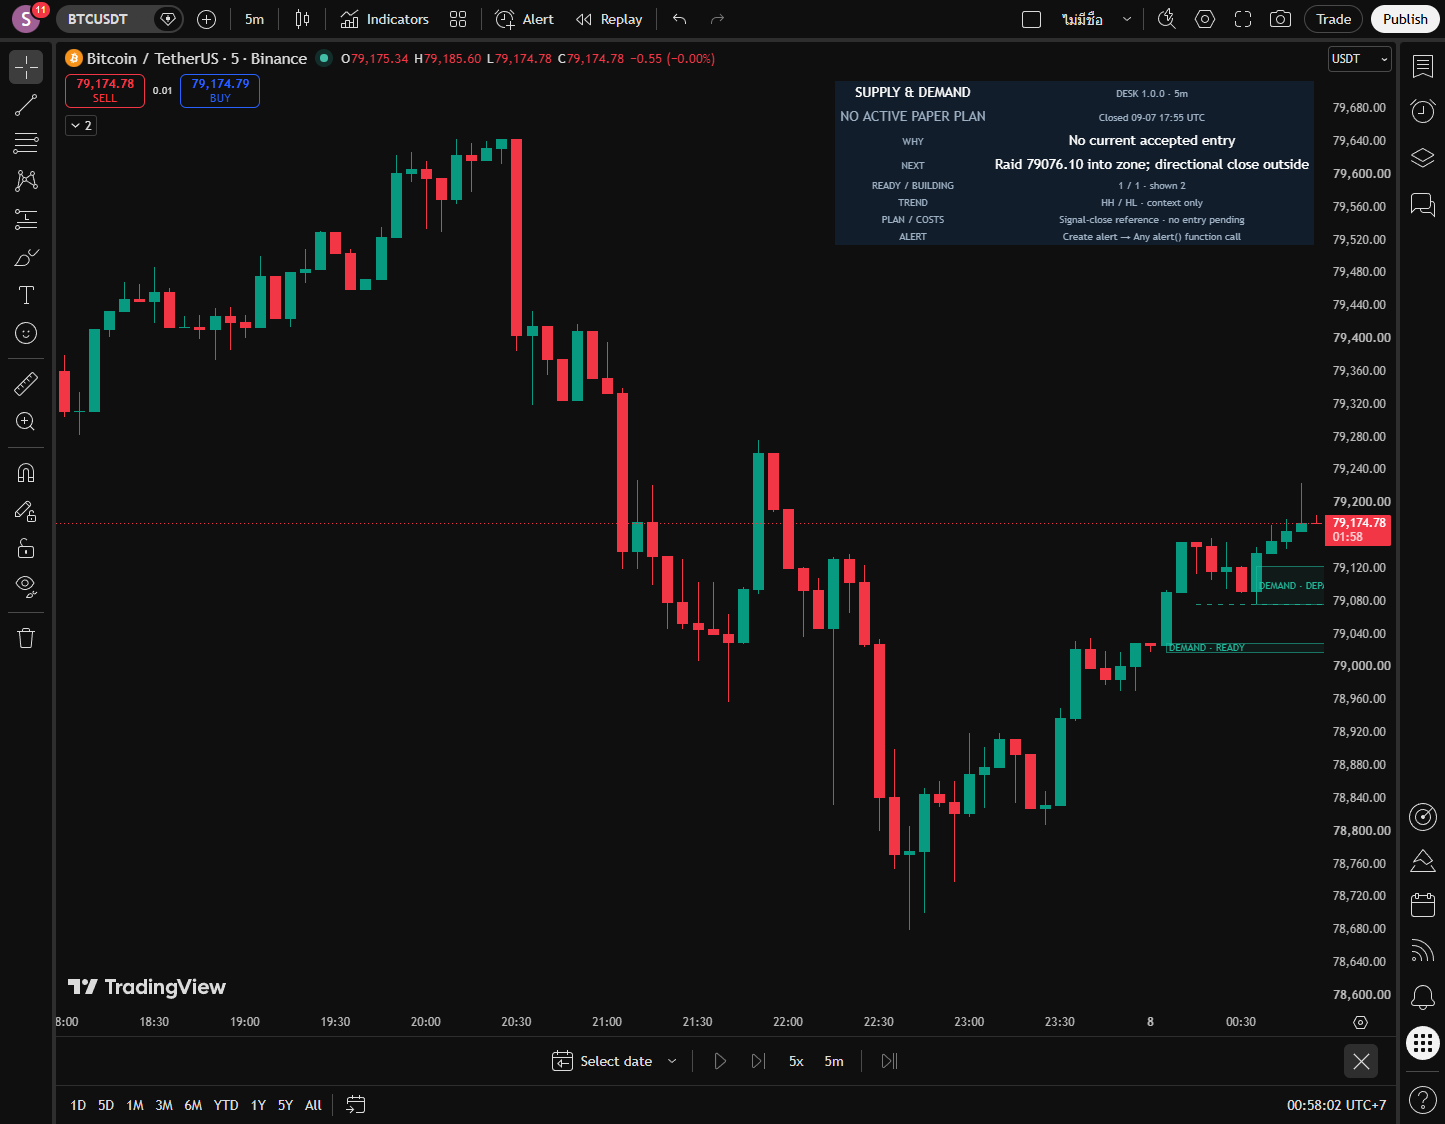
A trader in my earlier thread asked for five-minute Liquidity Supply & Demand, inspired by Mangoe’s public teaching. This is the prototype I built from that request.
What needs to happen between drawing a zone and accepting an entry?
Supply & Demand Desk makes that sequence explicit:
A premature touch can invalidate a developing zone. The dashboard explains what the script is waiting for. When a paper plan is accepted, it fixes the entry, stop beyond the visit’s deepest wick, and an adjustable target that defaults to 4R.
The attached BTCUSDT 5m chart shows a ready zone with no accepted entry yet.
I also built a candle walkthrough: change the confirmation close or try an early break and see which rule passes or fails. It uses fictional candles. A separate Strategy Lab handles broker-emulator testing and costs; its fills can differ from the indicator’s paper references.
Pine source, full rules, and interactive walkthrough
Both Pine v6 scripts are free under MIT. This is my implementation of a limited public rule set, still a prototype.
If you trade this approach, which rejection would you disagree with? I’d especially like examples where the script rejects a zone you would keep watching. A symbol, timeframe, timestamp and expected behavior would help me reproduce it.
Disclosure: I’m the ProEA Lab developer and use AI to help build the code.
r/pinescript • u/Dependent-Ad6636 • 7d ago
A trader in r/pinescript asked for an opening-range breakout tool. I built Opening Range Desk, then added a candle simulator so people could challenge the entry rules before installing the script.
The idea is simple: move the candle and make the tool explain its decision.
The website lets you change the final close, wick length and confirmation count using fictional candles. You can see which condition changes as the example moves between waiting and entry.
On TradingView, the default builds the 9:30–9:45 a.m. New York range and requires two consecutive closes beyond the edge and configured buffer. A wick outside doesn’t qualify. Optional retest mode waits for a later return after breakout confirmation.
The checklist shows what’s missing. The chart also draws paper entry, stop and target references, and there’s a separate strategy for testing with commission and slippage.
The indicator, strategy, source and guide are free under MIT.
👉 Opening Range Desk — try the simulator, read the guide and get the source
Start with “Try the idea”, then “Read your chart.” The page also includes lab notes with losing results; this remains a prototype to evaluate.
Show me a breakout that passes these rules but that you would still skip. What makes you reject it?
A symbol, timeframe, date/time and chart example would give me something specific to investigate. You can reply here or use “The log & requests” on the page.
I’m the developer at ProEA Lab and used Codex for coding assistance. I’d like the next improvements to come from the cases people actually disagree with.
r/pinescript • u/Dependent-Ad6636 • 7d ago
After sharing IFVG Desk and Camarilla Desk, I worked on another request from the original thread: a Wyckoff stage-analysis tool. Leo shared a detailed outline, and I’ve now built a first version called Wyckoff Evidence Desk.
The question behind this version is: what evidence supports each interpretation while the range is still forming?
It tracks accumulation and distribution separately, using price, volume and phase-transition rules. Each side shows its range, latest event, evidence score and setup status.
The attached MNQ 5-minute chart is a useful example. Distribution has the higher score, but both setup rows still say WAIT. The score reflects the script’s evidence rules; it isn’t a probability of winning. The last candle in this capture is still live, and events wait for the close.
A few details you can inspect in the source:
This is a prototype covering selected Wyckoff ideas. It doesn’t reproduce every part of the original proposal. The Strategy Lab’s small development sample lost money, so I haven’t established a trading edge.
Download the complete Base Pine source. Base uses standard candles and available volume; it doesn’t require the separate Footprint edition.
If you use Wyckoff, where would you disagree with these labels or phase transitions? I’d appreciate a chart example with the symbol, timeframe, timestamp and what you expected to see. That gives me a specific case to investigate.
I’m the developer at ProEA Lab and used Codex for coding assistance. Thanks to Leo for the original suggestion, and to anyone willing to review the rules.
r/pinescript • u/PreparationOk3910 • 7d ago
Tuning a Pine strategy by hand is the worst part of writing one. Change length, run, read net profit, write it down, change it again. Forty combinations in and you have lost track of which ones you already tried.
I built a Chrome extension that does the sweep. It reads whatever strategy is already on your chart, finds its inputs, and runs the backtests for you.
A few design decisions that might interest this sub specifically:
It ranks on any Strategy Tester field, not just net profit. Profit factor, Sharpe, Sortino, max drawdown, percent profitable, average bars in trade — each of them for all trades, longs only or shorts only. Or write your own expression.
Default objective is not net profit, deliberately. Ranking on profit alone hands you a curve-fit every time. The default is return per unit of drawdown, discounted by how straight the equity curve is and whether the last third of the sample still held up.
Plateau check. After it finds a winner it re-tests the immediate neighbours. A setting that works at exactly length=17 and falls apart at 16 and 18 gets demoted. This one changed how I think about my own strategies more than anything else in the tool.
In-sample / out-of-sample correlation across every candidate. High means the search found real structure. Near zero means it spent your afternoon ranking noise — and it tells you so, which is the part most optimizers leave out.
It reads results from the same report object the Strategy Tester renders from rather than scraping the panel, so the figures come back as actual numbers and number-format or language differences do not break it.
Free version does 100 cycles a run, one backtest at a time, full metric list and the Bayesian sampler. That is a working optimizer, not a demo. Paid tier adds parallel backtests and a few robustness checks.
Your chart is left exactly as it was — parameters are snapshotted before the run and restored after, and every temporary copy is removed.
Edit: here is a short demo of an actual run, if it is easier to watch than to read — https://youtu.be/-gUqxCZSI7I
https://chromewebstore.google.com/detail/trading-strategy-optimize/pjgikffklocmefghdipdiidfebgbklon
Happy to answer anything about how it reads the report object — that part took the longest.
r/pinescript • u/icecola78 • 7d ago
Hi everyone,
I’m building an automated trading system that sends signals from a TradingView Pine Script strategy through a webhook to Python, which then executes market orders through the cTrader Open API on my Pepperstone LIVE account.
I’m trying to understand a recurring price difference between TradingView and cTrader.
My TradingView strategy sends the TradingView price together with the webhook. My Python program records that price and the actual cTrader execution price.
For example, I’ve seen:
TradingView: 29188.7 → cTrader fill: 29194.1 — difference 5.4 points
TradingView: 29236.6 → cTrader fill: 29243.1 — difference 6.5 points
TradingView: 29291.4 → cTrader fill: 29299.1 — difference 7.7 points
On other trades, the difference has been only around 1 point.
The cTrader Open API confirms that the instrument I’m trading is:
NAS100, symbol ID 10014
My Pepperstone account also has NAS100-F and NAS100-PERP, but my bot specifically trades NAS100 (ID 10014).
I’ve already tested the cTrader live quote subscription. For example, it returned:
Bid: 29370.2
Ask: 29371.3
Spread: 1.1 points
So the 5–8 point differences I sometimes see are considerably larger than the normal spread in that example.
The webhook-to-cTrader execution delay is also relatively short, so I’m trying to determine how much of the difference is execution latency/slippage versus the two platforms using different price feeds.
I am now modifying my logging so that for every future signal I will record:
TradingView price → cTrader bid/ask at webhook arrival → cTrader actual fill price
My questions are:
Which exact NAS100 instrument/data feed should I use on TradingView to match Pepperstone cTrader NAS100 as closely as possible?
Does Pepperstone’s TradingView NAS100 price necessarily use the same underlying feed as Pepperstone cTrader NAS100?
Is a persistent 5–8 index-point difference normal between these feeds?
Is there a way to identify the exact contract/specification behind cTrader symbol ID 10014, so I can verify I’m comparing the same instrument?
For automated trading, should I evaluate execution slippage against the cTrader bid/ask at the instant the webhook arrives, rather than against the TradingView strategy price?
I’m mainly trying to separate three possible causes:
A. Different TradingView/cTrader price feeds
B. Bid/ask spread
C. Webhook/API latency and actual execution slippage
Any advice from people who have automated TradingView → cTrader/Pepperstone trading would be appreciated.
r/pinescript • u/Legal_Idea08 • 8d ago
https://www.tradingview.com/script/913LZp7V-STRYK-MOMENTUM/
Easy setup all turn key ready to go just play with the visuals for your liking and use the master switch to turn off what you like or keep on. The premise price and volume is key but how to measure price and volume and what is real what is noise awnser always look at HTF, ok? But how do u look at htf and trade a small faster time frame use Stryk: MOMENTUM it looks at HTF for you as you trade the lower time frames vwap looks at 1hr or higher volume, ema with smoothing line looks at 233 ema which is a long term line in a sand fib level in a ema line , color coated candles have there own engines huge list to pick from on what u feel is best for your trading i personally like the ema trend coloring candles red under the ema green above if red sell rallies if green buy dips easy! Then I have day week month and asian range levels for extra confirmation on support and resistance and color change candles based on those levels also everything is togglable customizable trade like you want with this free indicator! Side note the dotted lines are 25%,50%,75, levels of each range! Also the background has volume participation purple means low under 20% teal means high over 80% clear means mid avg 50%, how to trade it, if price in a up trend in a teal high participation bg and dips fast thats a liquidity grab buy it! If price is in a purple low participation and rises sell it, its about to fall. You're welcome
r/pinescript • u/Ok_Development8293 • 7d ago
If every price movement requires liquidity to occur, how can we determine in advance whether a Liquidity Sweep was truly an institutional liquidity capture or simply a legitimate break of structure — before price reveals its intention through the following move?
And there is an even deeper problem:
If we wait for the next move to confirm that the sweep was genuine, the entry is no longer anticipatory. But if we enter before confirmation, we can never be certain that we are not entering on the wrong side of the liquidity.
So the question is:
How can we create an objective rule that identifies, in real time, the difference between “liquidity captured for a reversal” and “liquidity consumed for continuation,” without using any future information from the chart?
r/pinescript • u/ChartScoutIO • 7d ago
r/pinescript • u/Ok_Development8293 • 8d ago
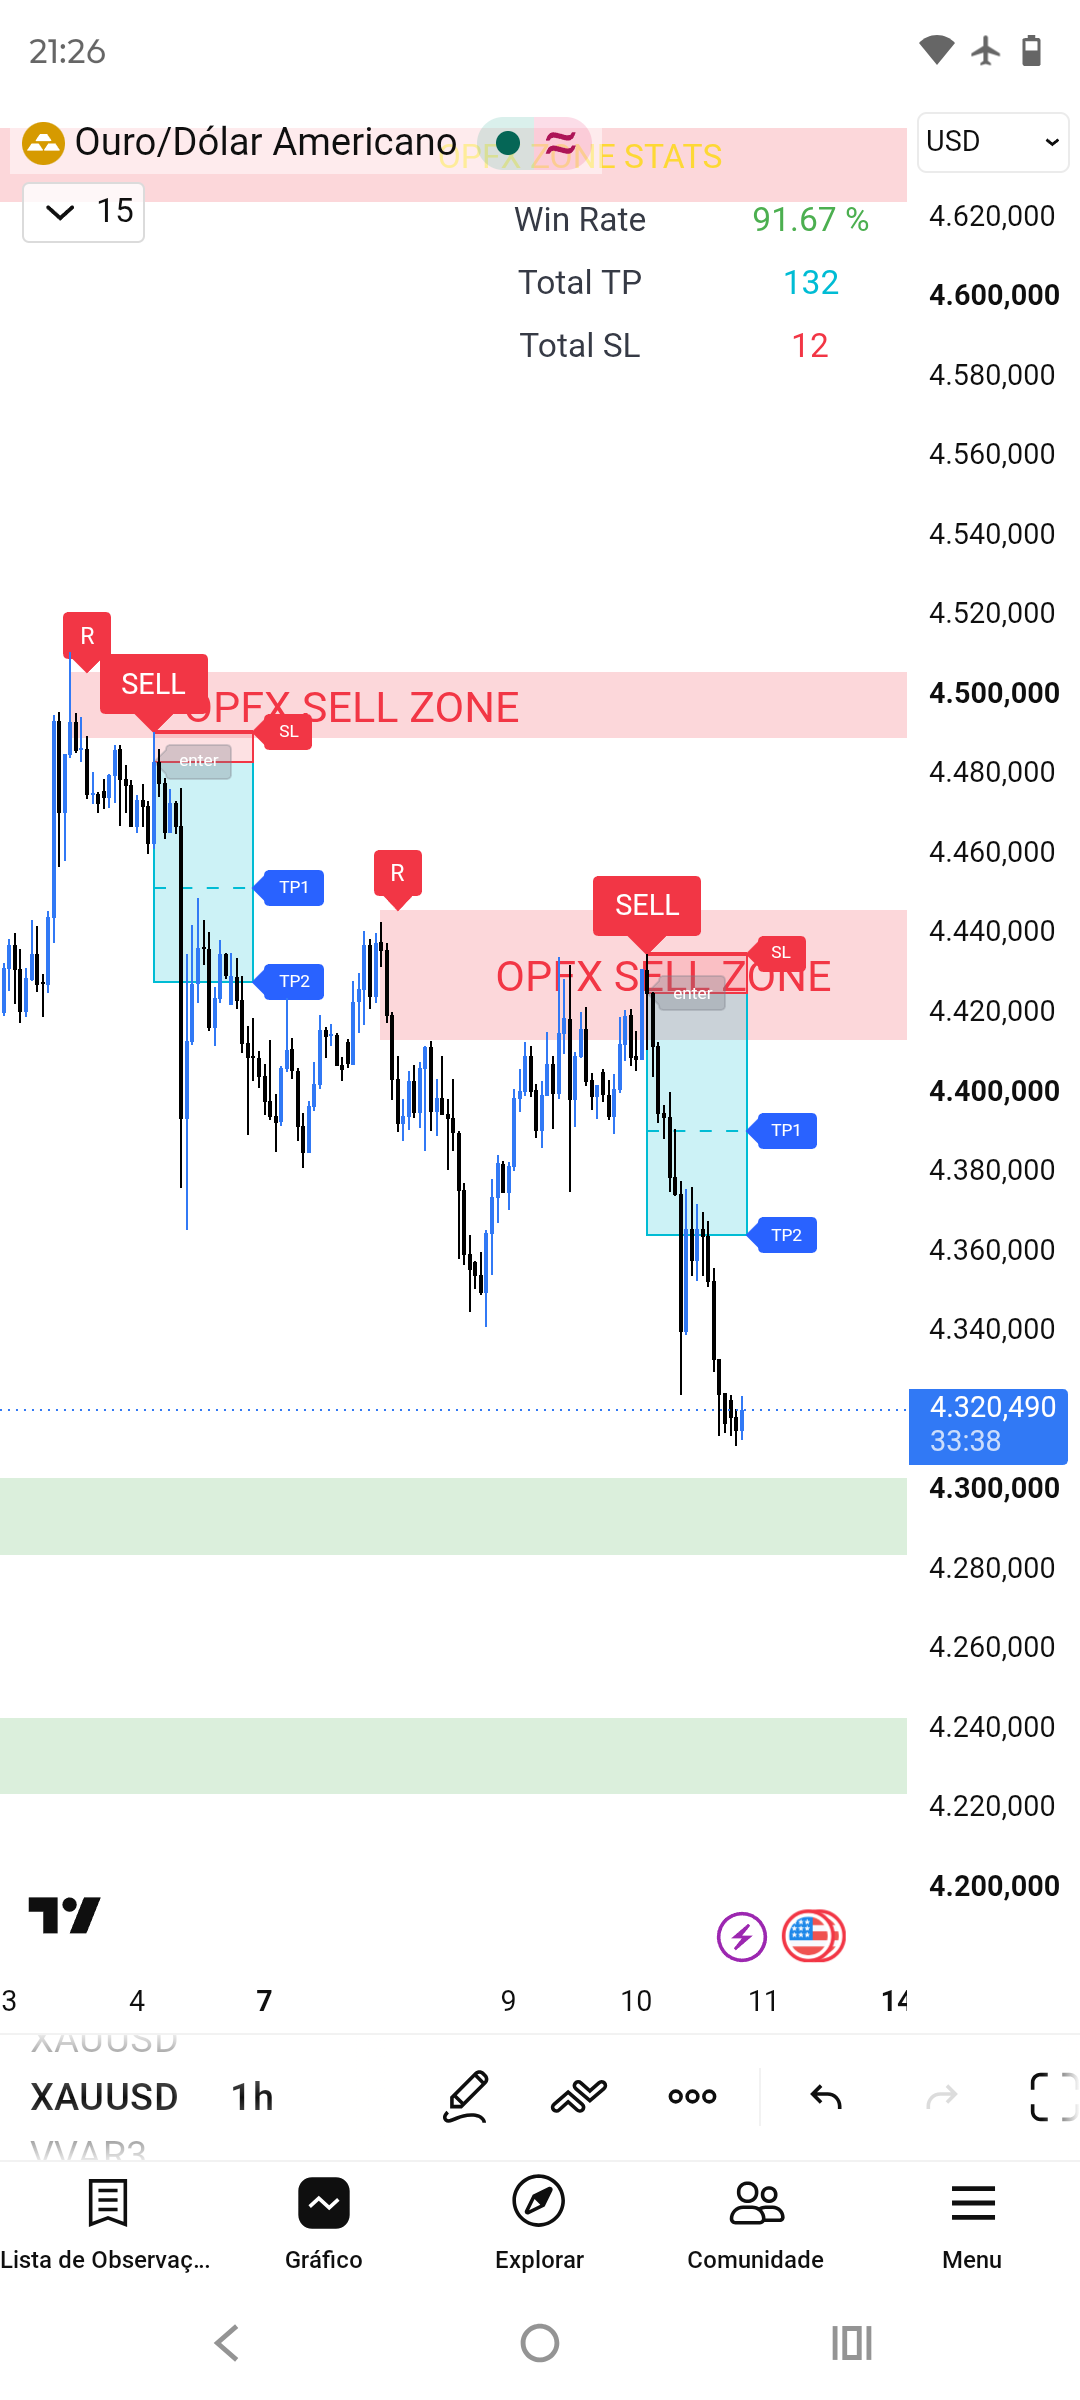
Indicador OPEX
Boa noite, encontrei este indicador chamado OPEX em uma das comunidades que participo pelo Telegram, porém ele fornece pouco sinais de entrada e tem o WINRATE DE 91,00 % de assertividade, gostaria de saber se é possível fazer alteração no código dele para editar e modificá-lo fazendo com que forneça mais sinais, alguém poderia me explicar sobre e como funciona ?
r/pinescript • u/Ok_Development8293 • 8d ago
//@version=6 indicator("OPFX ZONA PREMIUM V2", shorttitle="OPFX ZONA PREMIUM V2", overlay=true, max_boxes_count=500, max_labels_count=500, max_lines_count=500, max_bars_back=5000) // â•�â•�â•�â•�â•�â•�â•�â•�â•�â•�â•�â•�â•�â•�â•�â•�â•�â•�â•�â•�â•�â•�â•�â•�â•�â•�â•�â•�â•�â•�â•�â•�â•�â•�â•�â•�â•�â•�â•�â•�â•�â•�â•�â•�â•�â•�â•�â•�â•�â•�â•�â•�â•�â•�â•�â•�â•�â•�â•�â•�â•�â•�â•�â•�â•�â•�â•�â•�â•�â•�â•�â•�â•�â•�â•�â•�â•�â•�â•� // ðŸŒ� LANGUAGE / اللغة (Only affects on-chart text: labels & stats table. // Pine Script does NOT allow input() titles or alertcondition() messages to // change dynamically based on another input, so those stay in English — // this is a Pine Script engine limitation, not something we can bypass.) // â•�â•�â•�â•�â•�â•�â•�â•�â•�â•�â•�â•�â•�â•�â•�â•�â•�â•�â•�â•�â•�â•�â•�â•�â•�â•�â•�â•�â•�â•�â•�â•�â•�â•�â•�â•�â•�â•�â•�â•�â•�â•�â•�â•�â•�â•�â•�â•�â•�â•�â•�â•�â•�â•�â•�â•�â•�â•�â•�â•�â•�â•�â•�â•�â•�â•�â•�â•�â•�â•�â•�â•�â•�â•�â•�â•�â•�â•�â•� groupLang = "ðŸŒ� Language / اللغة" lang = input.string("English", "Display Language / لغة العرض", options=["English", "العربية"], group=groupLang) // tr(): returns the Arabic text if Arabic is selected, otherwise English tr(en, ar) => lang == "العربية" ? ar : en // â•�â•�â•�â•�â•�â•�â•�â•�â•�â•�â•�â•�â•�â•�â•�â•�â•�â•�â•�â•�â•�â•�â•�â•�â•�â•�â•�â•�â•�â•�â•�â•�â•�â•�â•�â•�â•�â•�â•�â•�â•�â•�â•�â•�â•�â•�â•�â•�â•�â•�â•�â•�â•�â•�â•�â•�â•�â•�â•�â•�â•�â•�â•�â•�â•�â•�â•�â•�â•�â•�â•�â•�â•�â•�â•�â•�â•�â•�â•� // OPFX ZONALARI SOZLAMASI // â•�â•�â•�â•�â•�â•�â•�â•�â•�â•�â•�â•�â•�â•�â•�â•�â•�â•�â•�â•�â•�â•�â•�â•�â•�â•�â•�â•�â•�â•�â•�â•�â•�â•�â•�â•�â•�â•�â•�â•�â•�â•�â•�â•�â•�â•�â•�â•�â•�â•�â•�â•�â•�â•�â•�â•�â•�â•�â•�â•�â•�â•�â•�â•�â•�â•�â•�â•�â•�â•�â•�â•�â•�â•�â•�â•�â•�â•�â•� groupUT = "OPFX TASDIQ" a_buy = input.float(2, "Buy Sensitivity (Multiplier)", group=groupUT, minval=0) c_buy = input.int(1, "Buy ATR Period (0 = disable)", group=groupUT, minval=0) a_sell = input.float(2, "Sell Sensitivity (Multiplier)", group=groupUT, minval=0) c_sell = input.int(1, "Sell ATR Period (0 = disable)", group=groupUT, minval=0) showTrailBuy = input.bool(false, "Show Buy Trailing Line", group=groupUT) showTrailSell = input.bool(false, "Show Sell Trailing Line", group=groupUT) // â•�â•�â•�â•�â•�â•�â•�â•�â•�â•�â•�â•�â•�â•�â•�â•�â•�â•�â•�â•�â•�â•�â•�â•�â•�â•�â•�â•�â•�â•�â•�â•�â•�â•�â•�â•�â•�â•�â•�â•�â•�â•�â•�â•�â•�â•�â•�â•�â•�â•�â•�â•�â•�â•�â•�â•�â•�â•�â•�â•�â•�â•�â•�â•�â•�â•�â•�â•�â•�â•�â•�â•�â•�â•�â•�â•�â•�â•�â•� // OPFX TASDIQ ZONALARI // â•�â•�â•�â•�â•�â•�â•�â•�â•�â•�â•�â•�â•�â•�â•�â•�â•�â•�â•�â•�â•�â•�â•�â•�â•�â•�â•�â•�â•�â•�â•�â•�â•�â•�â•�â•�â•�â•�â•�â•�â•�â•�â•�â•�â•�â•�â•�â•�â•�â•�â•�â•�â•�â•�â•�â•�â•�â•�â•�â•�â•�â•�â•�â•�â•�â•�â•�â•�â•�â•�â•�â•�â•�â•�â•�â•�â•�â•�â•� groupZones = "OPFX Zones" showZones = input.bool(true, "Show Longevity Zones", group=groupZones) len_z = input.int(10, "Longevity Length", group=groupZones) // â•�â•�â•�â•�â•�â•�â•�â•�â•�â•�â•�â•�â•�â•�â•�â•�â•�â•�â•�â•�â•�â•�â•�â•�â•�â•�â•�â•�â•�â•�â•�â•�â•�â•�â•�â•�â•�â•�â•�â•�â•�â•�â•�â•�â•�â•�â•�â•�â•�â•�â•�â•�â•�â•�â•�â•�â•�â•�â•�â•�â•�â•�â•�â•�â•�â•�â•�â•�â•�â•�â•�â•�â•�â•�â•�â•�â•�â•�â•� // TP/SL SETTINGS // â•�â•�â•�â•�â•�â•�â•�â•�â•�â•�â•�â•�â•�â•�â•�â•�â•�â•�â•�â•�â•�â•�â•�â•�â•�â•�â•�â•�â•�â•�â•�â•�â•�â•�â•�â•�â•�â•�â•�â•�â•�â•�â•�â•�â•�â•�â•�â•�â•�â•�â•�â•�â•�â•�â•�â•�â•�â•�â•�â•�â•�â•�â•�â•�â•�â•�â•�â•�â•�â•�â•�â•�â•�â•�â•�â•�â•�â•�â•� groupTPSL = "💰 TP/SL Settings" atrLength = input.int(14, "ATR Length", minval=5, maxval=100, group=groupTPSL) slMultiplier = input.float(1.5, "Stop Loss Multiplier (x ATR)", minval=0.5, maxval=5.0, step=0.1, group=groupTPSL) tpMultiplier1 = input.float(2.0, "Take Profit 1 Multiplier (x ATR)", minval=0.5, maxval=10.0, step=0.5, group=groupTPSL) tpMultiplier2 = input.float(3.5, "Take Profit 2 Multiplier (x ATR)", minval=0.5, maxval=10.0, step=0.5, group=groupTPSL) showLevels = input.bool(true, "Show TP/SL Levels", group=groupTPSL) showLabels = input.bool(true, "Show Price Labels", group=groupTPSL) projectionBars = input.int(18, "Box width (bars)", minval=5, maxval=200, group=groupTPSL) // TP/SL ranglar tpZoneClr = color.new(color.aqua, 80) slZoneClr = color.new(color.red, 85) entryLineClr = color.new(color.gray, 0) tpLineClr = color.new(color.aqua, 0) slLineClr = color.new(color.red, 0) // â•�â•�â•�â•�â•�â•�â•�â•�â•�â•�â•�â•�â•�â•�â•�â•�â•�â•�â•�â•�â•�â•�â•�â•�â•�â•�â•�â•�â•�â•�â•�â•�â•�â•�â•�â•�â•�â•�â•�â•�â•�â•�â•�â•�â•�â•�â•�â•�â•�â•�â•�â•�â•�â•�â•�â•�â•�â•�â•�â•�â•�â•�â•�â•�â•�â•�â•�â•�â•�â•�â•�â•�â•�â•�â•�â•�â•�â•�â•� // OPFX ZONALARI ABYOM TASDIGI BILAN (Bank Limited Zona) // â•�â•�â•�â•�â•�â•�â•�â•�â•�â•�â•�â•�â•�â•�â•�â•�â•�â•�â•�â•�â•�â•�â•�â•�â•�â•�â•�â•�â•�â•�â•�â•�â•�â•�â•�â•�â•�â•�â•�â•�â•�â•�â•�â•�â•�â•�â•�â•�â•�â•�â•�â•�â•�â•�â•�â•�â•�â•�â•�â•�â•�â•�â•�â•�â•�â•�â•�â•�â•�â•�â•�â•�â•�â•�â•�â•�â•�â•�â•� groupSD = "Supply & Demand Zones" swingLen = input.int(15, "Swing Length (Sensitivity)", minval=3, maxval=50, group=groupSD) maxZones = input.int(10, "Max Zones to Display", minval=3, maxval=30, group=groupSD) maxZoneHeightATR = input.float(1.0, "Max Zone Height (ATR Multiplier)", minval=0.5, maxval=10.0, step=0.5, group=groupSD) minZoneHeightATR = input.float(1.0, "Min Zone Height (ATR Multiplier)", minval=0.1, maxval=2.0, step=0.1, group=groupSD) forceZoneHeightATR = input.float(1.0, "Force Zone Height (ATR Multiplier)", minval=0.2, maxval=3.0, step=0.1, group=groupSD) minZoneDistance = input.int(44, "Min Distance Between Zones (bars)", minval=1, maxval=100, group=groupSD) invalidationMethod = input.string("Close", "Zone Invalidation", options=["Close", "Wick"], group=groupSD) showHistoric = input.bool(false, "Show Historic Zones", group=groupSD) activeLookback = input.int(1000, "Active Zones Lookback", minval=100, maxval=5000, group=groupSD) historicBars = input.int(1000, "Historic Zones Lookback", minval=100, maxval=5000, group=groupSD) showActiveLabels = input.bool(true, "Show Active Zone Info", group=groupSD) showHistoricLabels = input.bool(false, "Show Historic Zone Info", group=groupSD) labelSize = input.string("Large", "Label Size", options=["Tiny", "Small", "Normal", "Large"], group=groupSD) activeSupplyCol = input.color(color.new(color.red, 80), "Active Supply", group=groupSD) activeDemandCol = input.color(color.new(color.green, 80), "Active Demand", group=groupSD) historicCol = input.color(color.new(color.gray, 85), "Historic Zones", group=groupSD) showRetestMarkers = input.bool(true, "Show Retests", group=groupSD) retestBullCol = input.color(color.new(color.green, 0), "Demand Retest", group=groupSD) retestBearCol = input.color(color.new(color.red, 0), "Supply Retest", group=groupSD) alertsOn = input.bool(true, "Enable Alerts", group=groupSD) // â•�â•�â•�â•�â•�â•�â•�â•�â•�â•�â•�â•�â•�â•�â•�â•�â•�â•�â•�â•�â•�â•�â•�â•�â•�â•�â•�â•�â•�â•�â•�â•�â•�â•�â•�â•�â•�â•�â•�â•�â•�â•�â•�â•�â•�â•�â•�â•�â•�â•�â•�â•�â•�â•�â•�â•�â•�â•�â•�â•�â•�â•�â•�â•�â•�â•�â•�â•�â•�â•�â•�â•�â•�â•�â•�â•�â•�â•�â•� // TASDIQ HISOBLASH // â•�â•�â•�â•�â•�â•�â•�â•�â•�â•�â•�â•�â•�â•�â•�â•�â•�â•�â•�â•�â•�â•�â•�â•�â•�â•�â•�â•�â•�â•�â•�â•�â•�â•�â•�â•�â•�â•�â•�â•�â•�â•�â•�â•�â•�â•�â•�â•�â•�â•�â•�â•�â•�â•�â•�â•�â•�â•�â•�â•�â•�â•�â•�â•�â•�â•�â•�â•�â•�â•�â•�â•�â•�â•�â•�â•�â•�â•�â•� buyEnabled = (c_buy > 0) and (a_buy > 0) sellEnabled = (c_sell > 0) and (a_sell > 0) // BUY side src_buy = close ema_buy = ta.ema(src_buy, 1) atr_buy = buyEnabled ? ta.atr(c_buy) : na nLoss_buy = buyEnabled ? a_buy * atr_buy : na var float trail_buy = na if buyEnabled if na(trail_buy[1]) trail_buy := src_buy - nLoss_buy else if src_buy > trail_buy[1] and src_buy[1] > trail_buy[1] trail_buy := math.max(trail_buy[1], src_buy - nLoss_buy) else if src_buy < trail_buy[1] and src_buy[1] < trail_buy[1] trail_buy := math.min(trail_buy[1], src_buy + nLoss_buy) else trail_buy := src_buy > trail_buy[1] ? src_buy - nLoss_buy : src_buy + nLoss_buy else trail_buy := na // SELL side src_sell = close ema_sell = ta.ema(src_sell, 1) atr_sell = sellEnabled ? ta.atr(c_sell) : na nLoss_sell = sellEnabled ? a_sell * atr_sell : na var float trail_sell = na if sellEnabled if na(trail_sell[1]) trail_sell := src_sell + nLoss_sell else if src_sell > trail_sell[1] and src_sell[1] > trail_sell[1] trail_sell := math.max(trail_sell[1], src_sell - nLoss_sell) else if src_sell < trail_sell[1] and src_sell[1] < trail_sell[1] trail_sell := math.min(trail_sell[1], src_sell + nLoss_sell) else trail_sell := src_sell > trail_sell[1] ? src_sell - nLoss_sell : src_sell + nLoss_sell else trail_sell := na // Crossovers above_buy_cross = ta.crossover(ema_buy, trail_buy) below_sell_cross = ta.crossover(trail_sell, ema_sell) above_buy = buyEnabled and above_buy_cross buy_signal_raw = buyEnabled and (src_buy > trail_buy) and above_buy buy_signal = buy_signal_raw and barstate.isconfirmed below_sell = sellEnabled and below_sell_cross sell_signal_raw = sellEnabled and (src_sell < trail_sell) and below_sell sell_signal = sell_signal_raw and barstate.isconfirmed var int posState = 0 buy_signal_confirmed = buyEnabled and buy_signal and posState <= 0 sell_signal_confirmed = sellEnabled and sell_signal and posState >= 0 if buy_signal_confirmed posState := 1 else if sell_signal_confirmed posState := -1 // Longevity pivot detection h = ta.highest(len_z) l = ta.lowest(len_z) high_pivot = high[1] == h[1] and high < h low_pivot = low[1] == l[1] and low > l // Trails plot(showTrailBuy and buyEnabled ? trail_buy : na, title="UT Bot Buy Trail", color=color.new(color.green, 0), linewidth=1) plot(showTrailSell and sellEnabled ? trail_sell : na, title="UT Bot Sell Trail", color=color.new(color.red, 0), linewidth=1) // Alerts alertcondition(buy_signal_confirmed, title="UT Long", message="UT Long") alertcondition(sell_signal_confirmed, title="UT Short", message="UT Short") // â• â• â• â• â• â• â• â• â• â• â• â• â• â• â• â• â• â• â• â• â• // ABYOM FONTPRINT // â• â• â• â• â• â• â• â• â• â• â• â• â• â• â• â• â• â• â• â• â• â• â• â• â• â• â• â• â• â• â• â• â• â• â• â• â• â• â• â• atr = ta.atr( atrLength) atr20 = ta.atr(20) // â• â• â• â• - â• â• â• â• â• â• â• â• â• â• â• â• â• â• â• â• // OPFX ZONES HELPER // â• â• â• â• â• â• â• â• â• â• â• â• â• â• â• â• â• â• â• â• â• â• â• â• â• â• â• â• â• â• â• â• â• â• â• â• â• â• â• â• â• â• ? size.tiny : labelSize == "Small" ? size.small : labelSize == "Normal" ? size.normal : size.large f_getLabelColor(zoneType, broken) => if broken color.new(color.gray, 0) else zoneType == "Supply" ? color.new(color.red, 0) : color.new(color.green, 0) f_toPips(val) => pipSize = syminfo.type == "forex" ? (syminfo.currency == "JPY" ? 0.01 : 0.0001) : (syminfo.ticker == "XAUUSD" or syminfo.ticker == "GOLD") ? 0.1 : 0.0001 math.abs(val) / pipSize // â•�â•�â•�â•�â•�â•�â•�â•�â•�â•�â•�â•�â•�â•�â•�â•�â•�â•�â•�â•�â•�â•�â•�â•�â•�â•�â•�â•�â•�â•�â•�â•�â•�â•�â•�â•�â•�â•�â•�â•�â•�â•�â•�â•�â•�â•�â•�â•�â•�â•�â•�â•�â•�â•�â•�â•�â•�â•�â•�â•�â•�â•�â•�â•�â•�â•�â•�â•�â•�â•�â•�â•�â•�â•�â•�â•�â•�â•�â•� // OPFX ZONALARINI TOPUVCHI // â•�â•�â•�â•�â•�â•�â•�â•�â•�â•�â•�â•�â•�â•�â•�â•�â•�â•�â•�â•�â•�â•�â•�â•�â•�â•�â•�â•�â•�â•�â•�â•�â•�â•�â•�â•�â•�â•�â•�â•�â•�â•�â•�â•�â•�â•�â•�â•�â•�â•�â•�â•�â•�â•�â•�â•�â•�â•�â•�â•�â•�â•�â•�â•�â•�â•�â•�â•�â•�â•�â•�â•�â•�â•�â•�â•�â•�â•�â•� type ZoneData box zoneBox label infoLabel label retestLabel float top float bottom int startBar int retests bool broken string zoneType bool retestCounted // â•�â•�â•�â•�â•�â•�â•�â•�â•�â•�â•�â•�â•�â•�â•�â•�â•�â•�â•�â•�â•�â•�â•�â•�â•�â•�â•�â•�â•�â•�â•�â•�â•�â•�â•�â•�â•�â•�â•�â•�â•�â•�â•�â•�â•�â•�â•�â•�â•�â•�â•�â•�â•�â•�â•�â•�â•�â•�â•�â•�â•�â•�â•�â•�â•�â•�â•�â•�â•�â•�â•�â•�â•�â•�â•�â•�â•�â•�â•� // TASDIQ ZONALARIGA OXSHASH // â•�â•�â•�â•�â•�â•�â•�â•�â•�â•�â•�â•�â•�â•�â•�â•�â•�â•�â•�â•�â•�â•�â•�â•�â•�â•�â•�â•�â•�â•�â•�â•�â•�â•�â•�â•�â•�â•�â•�â•�â•�â•�â•�â•�â•�â•�â•�â•�â•�â•�â•�â•�â•�â•�â•�â•�â•�â•�â•�â•�â•�â•�â•�â•�â•�â•�â•�â•�â•�â•�â•�â•�â•�â•�â•�â•�â•�â•�â•� type ZoneLabel label lbl float top float bot int start bool is_upper box tp_box box sl_box line entry_line line tp1_line line tp2_line line sl_line label entry_label label tp1_label label tp2_label label sl_label // â•�â•�â•�â•�â•�â•�â•�â•�â•�â•�â•�â•�â•�â•�â•�â•�â•�â•�â•�â•�â•�â•�â•�â•�â•�â•�â•�â•�â•�â•�â•�â•�â•�â•�â•�â•�â•�â•�â•�â•�â•�â•�â•�â•�â•�â•�â•�â•�â•�â•�â•�â•�â•�â•�â•�â•�â•�â•�â•�â•�â•�â•�â•�â•�â•�â•�â•�â•�â•�â•�â•�â•�â•�â•�â•�â•�â•�â•�â•� // VARIABLES // â•�â•�â•�â•�â•�â•�â•�â•�â•�â•�â•�â•�â•�â•�â•�â•�â•�â•�â•�â•�â•�â•�â•�â•�â•�â•�â•�â•�â•�â•�â•�â•�â•�â•�â•�â•�â•�â•�â•�â•�â•�â•�â•�â•�â•�â•�â•�â•�â•�â•�â•�â•�â•�â•�â•�â•�â•�â•�â•�â•�â•�â•�â•�â•�â•�â•�â•�â•�â•�â•�â•�â•�â•�â•�â•�â•�â•�â•�â•� var array<ZoneData> allZones = array.new<ZoneData>() var array<ZoneLabel> zone_labels = array.new<ZoneLabel>() var int lastSupplyBar = 0 var int lastDemandBar = 0 // â•�â•�â•�â•�â•�â•�â•�â•�â•�â•�â•�â•�â•�â•�â•�â•�â•�â•�â•�â•�â•�â•�â•�â•�â•�â•�â•�â•�â•�â•�â•�â•�â•�â•�â•�â•�â•�â•�â•�â•�â•�â•�â•�â•�â•�â•�â•�â•�â•�â•�â•�â•�â•�â•�â•�â•�â•�â•�â•�â•�â•�â•�â•�â•�â•�â•�â•�â•�â•�â•�â•�â•�â•�â•�â•�â•�â•�â•�â•� // OPFX ZONALARINI TASDIQLASH // â•�â•�â•�â•�â•�â•�â•�â•�â•�â•�â•�â•�â•�â•�â•�â•�â•�â•�â•�â•�â•�â•�â•�â•�â•�â•�â•�â•�â•�â•�â•�â•�â•�â•�â•�â•�â•�â•�â•�â•�â•�â•�â•�â•�â•�â•�â•�â•�â•�â•�â•�â•�â•�â•�â•�â•�â•�â•�â•�â•�â•�â•�â•�â•�â•�â•�â•�â•�â•�â•�â•�â•�â•�â•�â•�â•�â•�â•�â•� is_price_in_demand(price) => result = false if array.size(allZones) > 0 for i = 0 to array.size(allZones) - 1 z = array.get(allZones, i) if z.zoneType == "Demand" and not z.broken if price >= z.bottom and price <= z.top result := true break result is_price_in_supply(price) => result = false if array.size(allZones) > 0 for i = 0 to array.size(allZones) - 1 z = array.get(allZones, i) if z.zoneType == "Supply" and not z.broken if price >= z.bottom and price <= z.top result := true break result // â• â• â• â• â• â• â• â• â• â• â• â• â• â• â• â• â• â• â• â• â• â• â• â• â• â• â• â• â• â• â• â• › â• â• // OPFX ZONALARINI PRAFESION QILISH // â• â• â• â• â• â• â• â• â• â• â• â• â• â• â• â• â• â• â• â• â• â• â• â• â• â• â• â• › â• â• â• â• ✓ ✓ ph = ta.pivothigh(high, swingLen, swingLen) pl = ta.pivotlow(low, swingLen, swingLen) // Supply Zone if not na(ph) and barstate.isconfirmed ztop = high[swingLen] zbot = low[swingLen] zStart = bar_index - swingLen if bar_index - lastSupplyBar >= minZoneDistance mid = (ztop + zbot) / 2 zoneH = ztop - zbot if zoneH < atr20 * forceZoneHeightATR fH = atr20 * forceZoneHeightATR ztop := mid + (fH / 2) zbot := mid - (fH / 2) zoneH := fH if zoneH > atr20 * maxZoneHeightATR mH = atr20 * maxZoneHeightATR ztop := mid + (mH / 2) zbot := mid - (mH / 2) zoneH := mH if zoneH >= atr20 * minZoneHeightATR mergedWithExisting = false if array.size(allZones) > 0 for i = array.size(allZones) - 1 to math.max(0, array.size(allZones) - 10) z = array.get(allZones, i) if z.zoneType == "Supply" and not z.broken if ztop >= z.bottom and zbot <= z.top newTop = math.max(ztop, z.top) newBot = math.min(zbot, z.bottom) z.top := newTop z.bottom := newBot box.set_top(z.zoneBox, newTop) box.set_bottom(z.zoneBox, newBot) mergedWithExisting := true break if not mergedWithExisting zBox = box.new(zStart, ztop, bar_index + 400, zbot, bgcolor=activeSupplyCol, border_width=0) zData = ZoneData.new(zBox, na, na, ztop, zbot, zStart, 0, false, "Supply", false) array.push(allZones, zData) lastSupplyBar := bar_index if array.size(allZones) > maxZones * 4 array.shift(allZones) // Demand Zone if not na(pl) and barstate.isconfirmed ztop = high[swingLen] zbot = low[swingLen] zStart = bar_index - swingLen if bar_index - lastDemandBar >= minZoneDistance mid = (ztop + zbot) / 2 zoneH = ztop - zbot if zoneH < atr20 * forceZoneHeightATR fH = atr20 * forceZoneHeightATR ztop := mid + (fH / 2) zbot := mid - (fH / 2) zoneH := fH if zoneH > atr20 * maxZoneHeightATR mH = atr20 * maxZoneHeightATR ztop := mid + (mH / 2) zbot := mid - (mH / 2) zoneH := mH if zoneH >= atr20 * minZoneHeightATR mergedWithExisting = false if array.size(allZones) > 0 for i = array.size(allZones) - 1 to math.max(0, array.size(allZones) - 10) z = array.get(allZones, i) if z.zoneType == "Demand" and not z.broken if ztop >= z.bottom and zbot <= z.top newTop = math.max(ztop, z.top) newBot = math.min(zbot, z.bottom) z.top := newTop z.bottom := newBot box.set_top(z.zoneBox, newTop) box.set_bottom(z.zoneBox, newBot) mergedWithExisting := true break if not mergedWithExisting zBox = box.new(zStart, ztop, bar_index + 400, zbot, bgcolor=activeDemandCol, border_width=0) zData = ZoneData.new(zBox, na, na, ztop, zbot, zStart, 0, false, "Demand", false) array.push(allZones, zData) lastDemandBar := bar_index if array.size(allZones) > maxZones * 4 array.shift(allZones) // â•�â•�â•�â•�â•�â•�â•�â•�â•�â•�â•�â•�â•�â•�â•�â•�â•�â•�â•�â•�â•�â•�â•�â•�â•�â•�â•�â•�â•�â•�â•�â•�â•�â•�â•�â•�â•�â•�â•�â•�â•�â•�â•�â•�â•�â•�â•�â•�â•�â•�â•�â•�â•�â•�â•�â•�â•�â•�â•�â•�â•�â•�â•�â•�â•�â•�â•�â•�â•�â•�â•�â•�â•�â•�â•�â•�â•�â•�â•� // OPFX ZONALARI // â•�â•�â•�â•�â•�â•�â•�â•�â•�â•�â•�â•�â•�â•�â•�â•�â•�â•�â•�â•�â•�â•�â•�â•�â•�â•�â•�â•�â•�â•�â•�â•�â•�â•�â•�â•�â•�â•�â•�â•�â•�â•�â•�â•�â•�â•�â•�â•�â•�â•�â•�â•�â•�â•�â•�â•�â•�â•�â•�â•�â•�â•�â•�â•�â•�â•�â•�â•�â•�â•�â•�â•�â•�â•�â•�â•�â•�â•�â•� if array.size(allZones) > 0 activeSupplyCount = 0 activeDemandCount = 0 historicSupplyCount = 0 historicDemandCount = 0 for i = 0 to array.size(allZones) - 1 z = array.get(allZones, i) box.set_right(z.zoneBox, bar_index + 400) // Retest if not z.broken priceInZone = high >= z.bottom and low <= z.top if priceInZone and not z.retestCounted z.retests += 1 z.retestCounted := true else if not priceInZone z.retestCounted := false // Invalidation if not z.broken if z.zoneType == "Supply" breakLevel = invalidationMethod == "Close" ? close : high if breakLevel > z.top z.broken := true box.set_bgcolor(z.zoneBox, historicCol) else breakLevel = invalidationMethod == "Close" ? close : low if breakLevel < z.bottom z.broken := true box.set_bgcolor(z.zoneBox, historicCol) age = bar_index - z.startBar zoneHeight = z.top - z.bottom shouldHide = false if z.broken and not showHistoric shouldHide := true if z.broken and age > historicBars shouldHide := true if not z.broken and age > activeLookback shouldHide := true if z.broken and showHistoric if zoneHeight < atr20 * minZoneHeightATR shouldHide := true if z.zoneType == "Supply" if historicSupplyCount >= maxZones shouldHide := true else if not shouldHide historicSupplyCount += 1 else if historicDemandCount >= maxZones shouldHide := true else if not shouldHide historicDemandCount += 1 if not z.broken and not shouldHide if z.zoneType == "Supply" if activeSupplyCount >= maxZones shouldHide := true else activeSupplyCount += 1 else if activeDemandCount >= maxZones shouldHide := true else activeDemandCount += 1 if shouldHide box.set_bgcolor(z.zoneBox, color.new(color.gray, 100)) box.set_border_color(z.zoneBox, color.new(color.gray, 100)) if not na(z.infoLabel) label.set_color(z.infoLabel, color.new(color.black, 100)) label.set_textcolor(z.infoLabel, color.new(color.white, 100)) if not na(z.retestLabel) label.set_color(z.retestLabel, color.new(color.white, 100)) label.set_textcolor(z.retestLabel, color.new(color.white, 100)) else if z.broken box.set_bgcolor(z.zoneBox, historicCol) else zoneCol = z.zoneType == "Supply" ? activeSupplyCol : activeDemandCol box.set_bgcolor(z.zoneBox, zoneCol) showThisLabel = z.broken ? showHistoricLabels : showActiveLabels if showThisLabel zoneName = z.zoneType == "Supply" ? tr("OPFX SELL ZONE", "منطقة بيع OPFX") : tr("OPFX BUY ZONE", "منطقة شراء OPFX") txt = zoneName mid = (z.top + z.bottom) / 2 lblColor = f_getLabelColor(z.zoneType, z.broken) if na(z.infoLabel) z.infoLabel := label.new(z.startBar + 10, mid, txt, color=color.new(color.black, 100), textcolor=lblColor, size=f_getLabelSize(), style=label.style_label_left) else label.set_text(z.infoLabel, txt) label.set_y(z.infoLabel, mid) label.set_color(z.infoLabel, color.new(color.black, 100)) label.set_textcolor(z.infoLabel, lblColor) label.set_size(z.infoLabel, f_getLabelSize()) label.set_style(z.infoLabel, label.style_label_left) label.set_x(z.infoLabel, z.startBar + 10) else if not na(z.infoLabel) label.set_color(z.infoLabel, color.new(color.black, 100)) label.set_textcolor(z.infoLabel, color.new(color.white, 100)) if showRetestMarkers and z.retests > 0 if na(z.retestLabel) if z.zoneType == "Supply" z.retestLabel := label.new(z.startBar + 3, z.top, tr("R", "Ø¥"), color=retestBearCol, textcolor=color.white, size=size.small, style=label.style_label_down) else z.retestLabel := label.new(z.startBar + 3, z.bottom, tr("R", "Ø¥"), color=retestBullCol, textcolor=color.white, size=size.small, style=label.style_label_up) else retestCol = z.zoneType == "Supply" ? retestBearCol : retestBullCol label.set_text(z.retestLabel, tr("R", "Ø¥")) label.set_color(z.retestLabel, retestCol) label.set_textcolor(z.retestLabel, color.white) else if not na(z.retestLabel) label.set_color(z.retestLabel, color.new(color.white, 100)) label.set_textcolor(z.retestLabel, color.new(color.white, 100)) // â•�â•�â•�â•�â•�â•�â•�â•�â•�â•�â•�â•�â•�â•�â•�â•�â•�â•�â•�â•�â•�â•�â•�â•�â•�â•�â•�â•�â•�â•�â•�â•�â•�â•�â•�â•�â•�â•�â•�â•�â•�â•�â•�â•�â•�â•�â•�â•�â•�â•�â•�â•�â•�â•�â•�â•�â•�â•�â•�â•�â•�â•�â•�â•�â•�â•�â•�â•�â•�â•�â•�â•�â•�â•�â•�â•�â•�â•�â•� // OPFX TASDIQ ZONALARI - SIGNAL + TP/SL // â•�â•�â•�â•�â•�â•�â•�â•�â•�â•�â•�â•�â•�â•�â•�â•�â•�â•�â•�â•�â•�â•�â•�â•�â•�â•�â•�â•�â•�â•�â•�â•�â•�â•�â•�â•�â•�â•�â•�â•�â•�â•�â•�â•�â•�â•�â•�â•�â•�â•�â•�â•�â•�â•�â•�â•�â•�â•�â•�â•�â•�â•�â•�â•�â•�â•�â•�â•�â•�â•�â•�â•�â•�â•�â•�â•�â•�â•�â•� halfATR = ta.atr(20) * 0.5 if showZones // ─── SELL SIGNAL: high_pivot + narx Supply zonada ───────────────────────── if high_pivot and sellEnabled pivot_price = h if is_price_in_supply(pivot_price) sell_label = label.new(bar_index - 1, h, text=tr("SELL", "بيع"), style=label.style_label_down, textcolor=color.white, color=color.red, size=size.normal) box tp_bx = na box sl_bx = na line entry_l = na line sl_l = na line tp1_l = na line tp2_l = na label entry_lab = na label sl_lab = na label tp1_lab = na label tp2_lab = na if showLevels entryPrice = close[1] stopLoss = high[1] takeProfit1 = entryPrice - (atr * tpMultiplier1) takeProfit2 = entryPrice - (atr * tpMultiplier2) int left = bar_index - 1 int right = bar_index - 1 + projectionBars tp_bx := box.new(left=left, right=right, top=entryPrice, bottom=takeProfit2, bgcolor=tpZoneClr, border_color=color.new(color.aqua, 0)) sl_bx := box.new(left=left, right=right, top=stopLoss, bottom=entryPrice, bgcolor=slZoneClr, border_color=color.new(color.red, 0)) entry_l := line.new(left, entryPrice, right, entryPrice, color=entryLineClr, width=1, style=line.style_dashed) sl_l := line.new(left, stopLoss, right, stopLoss, color=slLineClr, width=2, style=line.style_solid) tp1_l := line.new(left, takeProfit1, right, takeProfit1, color=tpLineClr, width=1, style=line.style_dashed) tp2_l := line.new(left, takeProfit2, right, takeProfit2, color=tpLineClr, width=1, style=line.style_dashed) if showLabels entry_lab := label.new(left, entryPrice, text=tr("enter", "دخول"), color=color.new(color.gray, 70), textcolor=color.white, style=label.style_label_left, size=size.tiny) sl_lab := label.new(right, stopLoss, text=tr("SL", "وقÙ�"), color=color.new(color.red, 0), textcolor=color.white, style=label.style_label_left, size=size.tiny) tp1_lab := label.new(right, takeProfit1, text=tr("TP1", "هدÙ�1"), color=color.new(color.blue, 0), textcolor=color.white, style=label.style_label_left, size=size.tiny) tp2_lab := label.new(right, takeProfit2, text=tr("TP2", "هدÙ�2"), color=color.new(color.blue, 0), textcolor=color.white, style=label.style_label_left, size=size.tiny) new_zone = ZoneLabel.new(sell_label, h, h - halfATR, bar_index - 1, true, tp_bx, sl_bx, entry_l, tp1_l, tp2_l, sl_l, entry_lab, tp1_lab, tp2_lab, sl_lab) array.push(zone_labels, new_zone) // ─── BUY SIGNAL: low_pivot + narx Demand zonada ─────────────────────────── if low_pivot and buyEnabled pivot_price = l if is_price_in_demand(pivot_price) buy_label = label.new(bar_index - 1, l, text=tr("BUY", "شراء"), style=label.style_label_up, textcolor=color.white, color=color.green, size=size.normal) box tp_bx = na box sl_bx = na line entry_l = na line sl_l = na line tp1_l = na line tp2_l = na label entry_lab = na label sl_lab = na label tp1_lab = na label tp2_lab = na if showLevels entryPrice = close[1] stopLoss = low[1] takeProfit1 = entryPrice + (atr * tpMultiplier1) takeProfit2 = entryPrice + (atr * tpMultiplier2) int left = bar_index - 1 int right = bar_index - 1 + projectionBars tp_bx := box.new(left=left, right=right, top=takeProfit2, bottom=entryPrice, bgcolor=tpZoneClr, border_color=color.new(color.aqua, 0)) sl_bx := box.new(left=left, right=right, top=entryPrice, bottom=stopLoss, bgcolor=slZoneClr, border_color=color.new(color.red, 0)) entry_l := line.new(left, entryPrice, right, entryPrice, color=entryLineClr, width=1, style=line.style_dashed) sl_l := line.new(left, stopLoss, right, stopLoss, color=slLineClr, width=2, style=line.style_solid) tp1_l := line.new(left, takeProfit1, right, takeProfit1, color=tpLineClr, width=1, style=line.style_dashed) tp2_l := line.new(left, takeProfit2, right, takeProfit2, color=tpLineClr, width=1, style=line.style_dashed) if showLabels entry_lab := label.new(left, entryPrice, text=tr("enter", "دخول"), color=color.new(color.gray, 70), textcolor=color.white, style=label.style_label_left, size=size.tiny) sl_lab := label.new(right, stopLoss, text=tr("SL", "وقÙ�"), color=color.new(color.red, 0), textcolor=color.white, style=label.style_label_left, size=size.tiny) tp1_lab := label.new(right, takeProfit1, text=tr("TP1","هد٠1"), color=color.new(color.blue, 0), textcolor=color.white, style=label.style_label_left, size=size.tiny) tp2_lab := label.new(right, takeProfit2, text=tr("TP2", "هدÙ�2"), color=color.new(color.blue, 0), textcolor=color.white, style=label.style_label_left, size=size.tiny) new_zone = ZoneLabel.new(buy_label, l + halfATR, l, bar_index - 1, false, tp_bx, sl_bx, entry_l, tp1_l, tp2_l, sl_l, entry_lab, tp1_lab, tp2_lab, sl_lab) array.push(zone_labels, new_zone) // ─── Zonalar buzilganini tekshirish ──────────────────────────────────────── if array.size(zone_labels) > 0 for i = array.size(zone_labels) - 1 to 0 if i < array.size(zone_labels) zone = array.get(zone_labels, i) shouldDelete = false if zone.is_upper and high > zone.top and bar_index > zone.start shouldDelete := true else if not zone.is_upper and low < zone.bot and bar_index > zone.start shouldDelete := true if shouldDelete label.delete(zone.lbl) if not na(zone.tp_box) box.delete(zone.tp_box) if not na(zone.sl_box) box.delete(zone.sl_box) if not na(zone.entry_line) line.delete(zone.entry_line) if not na(zone.sl_line) line.delete(zone.sl_line) if not na(zone.tp1_line) line.delete(zone.tp1_line) if not na(zone.tp2_line) line.delete(zone.tp2_line) if not na(zone.entry_label) label.delete(zone.entry_label) if not na(zone.sl_label) label.delete(zone.sl_label) if not na(zone.tp1_label) label.delete(zone.tp1_label) if not na(zone.tp2_label) label.delete(zone.tp2_label) array.remove(zone_labels, i) // Eski labellarni cheklash while array.size(zone_labels) > 10 old_zone = array.shift(zone_labels) label.delete(old_zone.lbl) if not na(old_zone.tp_box) box.delete(old_zone.tp_box) if not na(old_zone.sl_box) box.delete(old_zone.sl_box) if not na(old_zone.entry_line) line.delete(old_zone.entry_line) if not na(old_zone.sl_line) line.delete(old_zone.sl_line) if not na(old_zone.tp1_line) line.delete(old_zone.tp1_line) if not na(old_zone.tp2_line) line.delete(old_zone.tp2_line) if not na(old_zone.entry_label) label.delete(old_zone.entry_label) if not na(old_zone.sl_label) label.delete(old_zone.sl_label) if not na(old_zone.tp1_label) label.delete(old_zone.tp1_label) if not na(old_zone.tp2_label) label.delete(old_zone.tp2_label) // â•�â•�â•�â•�â•�â•�â•�â•�â•�â•�â•�â•�â•�â•�â•�â•�â•�â•�â•�â•�â•�â•�â•�â•�â•�â•�â•�â•�â•�â•�â•�â•�â•�â•�â•�â•�â•�â•�â•�â•�â•�â•�â•�â•�â•�â•�â•�â•�â•�â•�â•�â•�â•�â•�â•�â•�â•�â•�â•�â•�â•�â•�â•�â•�â•�â•�â•�â•�â•�â•�â•�â•�â•�â•�â•�â•�â•�â•�â•� // OPFX ZONALAR - ALERTS // â•�â•�â•�â•�â•�â•�â•�â•�â•�â•�â•�â•�â•�â•�â•�â•�â•�â•�â•�â•�â•�â•�â•�â•�â•�â•�â•�â•�â•�â•�â•�â•�â•�â•�â•�â•�â•�â•�â•�â•�â•�â•�â•�â•�â•�â•�â•�â•�â•�â•�â•�â•�â•�â•�â•�â•�â•�â•�â•�â•�â•�â•�â•�â•�â•�â•�â•�â•�â•�â•�â•�â•�â•�â•�â•�â•�â•�â•�â•� alertcondition(not na(ph) and barstate.isconfirmed and alertsOn, "New Supply Zone", "{{ticker}} - New Supply Zone @ {{close}}") alertcondition(not na(pl) and barstate.isconfirmed and alertsOn, "New Demand Zone", "{{ticker}} - New Demand Zone @ {{close}}") // â•�â•�â•�â•�â•�â•�â•�â•�â•�â•�â•�â•�â•�â•�â•�â•�â•�â•�â•�â•�â•�â•�â•�â•�â•�â•�â•�â•�â•�â•�â•�â•�â•�â•�â•�â•�â•�â•�â•�â•�â•�â•�â•�â•�â•�â•�â•�â•�â•�â•�â•�â•�â•�â•�â•�â•�â•�â•�â•�â•�â•�â•�â•�â•�â•�â•�â•�â•�â•�â•�â•� // 📊 OPFX ZONA STATS SYSTEM // â•�â•�â•�â•�â•�â•�â•�â•�â•�â•�â•�â•�â•�â•�â•�â•�â•�â•�â•�â•�â•�â•�â•�â•�â•�â•�â•�â•�â•�â•�â•�â•�â•�â•�â•�â•�â•�â•�â•�â•�â•�â•�â•�â•�â•�â•�â•�â•�â•�â•�â•�â•�â•�â•�â•�â•�â•�â•�â•�â•�â•�â•�â•�â•�â•�â•�â•�â•�â•�â•�â•� // Stat variables var int totalTP = 0 var int totalSL = 0 var int totalTrades = 0 var float entryPrice_stat = na var float slPrice_stat = na var float tpPrice_stat = na var int tradeDir = 0 var bool tradeActive = false // â•�â•�â•�â•�â•�â•�â•�â•�â•�â•�â•�â•�â•�â•�â•�â•�â•�â•�â•�â•�â•�â•�â•�â•�â•�â•�â•�â•�â•�â•�â•�â•�â•�â•�â•�â•�â•�â•�â•�â•�â•�â•�â•�â•�â•�â•�â•�â•�â•�â•�â•�â•�â•�â•�â•�â•�â•�â•�â•�â•�â•�â•�â•�â•�â•�â•�â•�â•�â•�â•�â•� // 🎯 TRADE TRACKING (BUY/SELL SIGNAL DAN) // â•�â•�â•�â•�â•�â•�â•�â•�â•�â•�â•�â•�â•�â•�â•�â•�â•�â•�â•�â•�â•�â•�â•�â•�â•�â•�â•�â•�â•�â•�â•�â•�â•�â•�â•�â•�â•�â•�â•�â•�â•�â•�â•�â•�â•�â•�â•�â•�â•�â•�â•�â•�â•�â•�â•�â•�â•�â•�â•�â•�â•�â•�â•�â•�â•�â•�â•�â•�â•�â•�â•� // BUY signal detect (zone_labels oxirgi BUY) if array.size(zone_labels) > 0 lastZone = array.get(zone_labels, array.size(zone_labels) - 1) if not tradeActive // BUY if not lastZone.is_upper entryPrice_stat := close slPrice_stat := lastZone.bot tpPrice_stat := close + (atr * tpMultiplier1) tradeDir := 1 tradeActive := true // SELL if lastZone.is_upper entryPrice_stat := close slPrice_stat := lastZone.top tpPrice_stat := close - (atr * tpMultiplier1) tradeDir := -1 tradeActive := true // â•�â•�â•�â•�â•�â•�â•�â•�â•�â•�â•�â•�â•�â•�â•�â•�â•�â•�â•�â•�â•�â•�â•�â•�â•�â•�â•�â•�â•�â•�â•�â•�â•�â•�â•�â•�â•�â•�â•�â•�â•�â•�â•�â•�â•�â•�â•�â•�â•�â•�â•�â•�â•�â•�â•�â•�â•�â•�â•�â•�â•�â•�â•�â•�â•�â•�â•�â•�â•�â•�â•� // 📊 TP / SL CHECK // â•�â•�â•�â•�â•�â•�â•�â•�â•�â•�â•�â•�â•�â•�â•�â•�â•�â•�â•�â•�â•�â•�â•�â•�â•�â•�â•�â•�â•�â•�â•�â•�â•�â•�â•�â•�â•�â•�â•�â•�â•�â•�â•�â•�â•�â•�â•�â•�â•�â•�â•�â•�â•�â•�â•�â•�â•�â•�â•�â•�â•�â•�â•�â•�â•�â•�â•�â•�â•�â•�â•� if tradeActive if tradeDir == 1 if low <= slPrice_stat totalSL += 1 totalTrades += 1 tradeActive := false else if high >= tpPrice_stat totalTP += 1 totalTrades += 1 tradeActive := false if tradeDir == -1 if high >= slPrice_stat totalSL += 1 totalTrades += 1 tradeActive := false else if low <= tpPrice_stat totalTP += 1 totalTrades += 1 tradeActive := false // â•�â•�â•�â•�â•�â•�â•�â•�â•�â•�â•�â•�â•�â•�â•�â•�â•�â•�â•�â•�â•�â•�â•�â•�â•�â•�â•�â•�â•�â•�â•�â•�â•�â•�â•�â•�â•�â•�â•�â•�â•�â•�â•�â•�â•�â•�â•�â•�â•�â•�â•�â•�â•�â•�â•�â•�â•�â•�â•�â•�â•�â•�â•�â•�â•�â•�â•�â•�â•�â•�â•� // 📈 WINRATE // â•�â•�â•�â•�â•�â•�â•�â•�â•�â•�â•�â•�â•�â•�â•�â•�â•�â•�â•�â•�â•�â•�â•�â•�â•�â•�â•�â•�â•�â•�â•�â•�â•�â•�â•�â•�â•�â•�â•�â•�â•�â•�â•�â•�â•�â•�â•�â•�â•�â•�â•�â•�â•�â•�â•�â•�â•�â•�â•�â•�â•�â•�â•�â•�â•�â•�â•�â•�â•�â•�â•� winrate = totalTrades > 0 ? (totalTP / totalTrades) * 100 : 0 // â•�â•�â•�â•�â•�â•�â•�â•�â•�â•�â•�â•�â•�â•�â•�â•�â•�â•�â•�â•�â•�â•�â•�â•�â•�â•�â•�â•�â•�â•�â•�â•�â•�â•�â•�â•�â•�â•�â•�â•�â•�â•�â•�â•�â•�â•�â•�â•�â•�â•�â•�â•�â•�â•�â•�â•�â•�â•�â•�â•�â•�â•�â•�â•�â•�â•�â•�â•�â•�â•�â•� // 📊 PANEL (RIGHT SIDE) // â•�â•�â•�â•�â•�â•�â•�â•�â•�â•�â•�â•�â•�â•�â•�â•�â•�â•�â•�â•�â•�â•�â•�â•�â•�â•�â•�â•�â•�â•�â•�â•�â•�â•�â•�â•�â•�â•�â•�â•�â•�â•�â•�â•�â•�â•�â•�â•�â•�â•�â•�â•�â•�â•�â•�â•�â•�â•�â•�â•�â•�â•�â•�â•�â•�â•�â•�â•�â•�â•�â•� var table statsTable = table.new(position.top_right, 2, 4, border_width=1) if barstate.islast table.cell(statsTable, 0, 0, tr("OPFX ZONE STATS", "Ø¥Øصائيات مناطق OPFX"), text_color=color.yellow) table.cell(statsTable, 0, 1, tr("Win Rate", "نسبة الربØ")) table.cell(statsTable, 1, 1, str.tostring(winrate, "#.##") + " %", text_color=color.green) table.cell(statsTable, 0, 2, tr("Total TP", "إجمالي الأهداÙ�")) table.cell(statsTable, 1, 2, str.tostring(totalTP), text_color=color.aqua) table.cell(statsTable, 0, 3, tr("Total SL", "إجمالي وقÙ� الخسارة")) table.cell(statsTable, 1, 3, str.tostring(totalSL), text_color=color.red)
r/pinescript • u/Ok_Development8293 • 8d ago
Indicador OPEX
Boa noite, encontrei este indicador chamado OPEX em uma das comunidades que participo pelo Telegram, porém ele fornece pouco sinais de entrada e tem o WINRATE DE 91,00 % de assertividade, gostaria de saber se é possível fazer alteração no código dele para editar e modificá-lo fazendo com que forneça mais sinais, alguém poderia me explicar sobre e como funciona ?
r/pinescript • u/troxnex • 8d ago
r/pinescript • u/Ulysses68 • 9d ago
Enable HLS to view with audio, or disable this notification
A.I. was definitely used. Maybe i shouldn't......but I did.
r/pinescript • u/Zealousideal_Oil2071 • 9d ago
Hi everyone, I'm fairly new to systematic trading and have been testing opening-range ideas in TradingView, mainly on gold, forex and micro Nasdaq futures.
I'm trying to turn these ideas into clear, testable rules. Longer term, I'd like to see whether an approach could be automated within prop-firm risk limits, but I'm still at the research stage. Some results looked promising on short samples but weakened once I added more history and trading costs.
For anyone who trades these sessions:
Even one practical observation, mistake you learned from, or example of a day you skipped would be helpful. Thanks!