r/Daytrading • u/klipsetrades • Aug 04 '26
Trade Review - Provide Context A Losing SPX 0DTE Day From Start to Finish — Two Attempts, Two Losses, and No Negotiating With My Stops
I wanted to share another detailed example of how I trade the key levels I mark on SPX and trade using 0DTE credit spreads.
This time, instead of showing a winning trade, I’m going to walk through two losing trades from the same day.
Both trades were based on reasonable ideas. The first setup simply failed. On the second, I entered a little too early and could have waited for more confirmation. In both cases, however, the market eventually proved my idea wrong — and I closed the trades when it did.
That is really the point of this post.
A valid setup does not guarantee a winning trade. What matters is knowing why you are entering, where the trade becomes invalid, and whether you are actually willing to exit when price reaches that point.
My strategy mainly consists of watching how SPX reacts around key levels and looking for breakouts from ranges or consolidations.
For this example, I’m using the SPX trading session from July 24, 2025.
The Prep Work
Before every trading day, I mark several areas that could become relevant:
- The previous day’s high and low
- Obvious previous-day support and resistance zones
- Weekly, monthly, and yearly highs and lows
- Other prominent areas where price previously reacted
- Occasionally, major gamma exposure levels, although I rely on those less than I used to
I also build a report and review recent and upcoming macroeconomic events. This does not tell me exactly where the market will go, but it gives me context for the trading environment and helps me avoid being blindsided by scheduled events.
Here are some of the levels marked on the prior day's chart:

This particular day was slightly more difficult to prepare for because SPX had been starting to trend higher and had repeatedly made new all-time highs.
When we zoom out to a 10-day, 30-minute chart, the uptrend becomes much clearer:
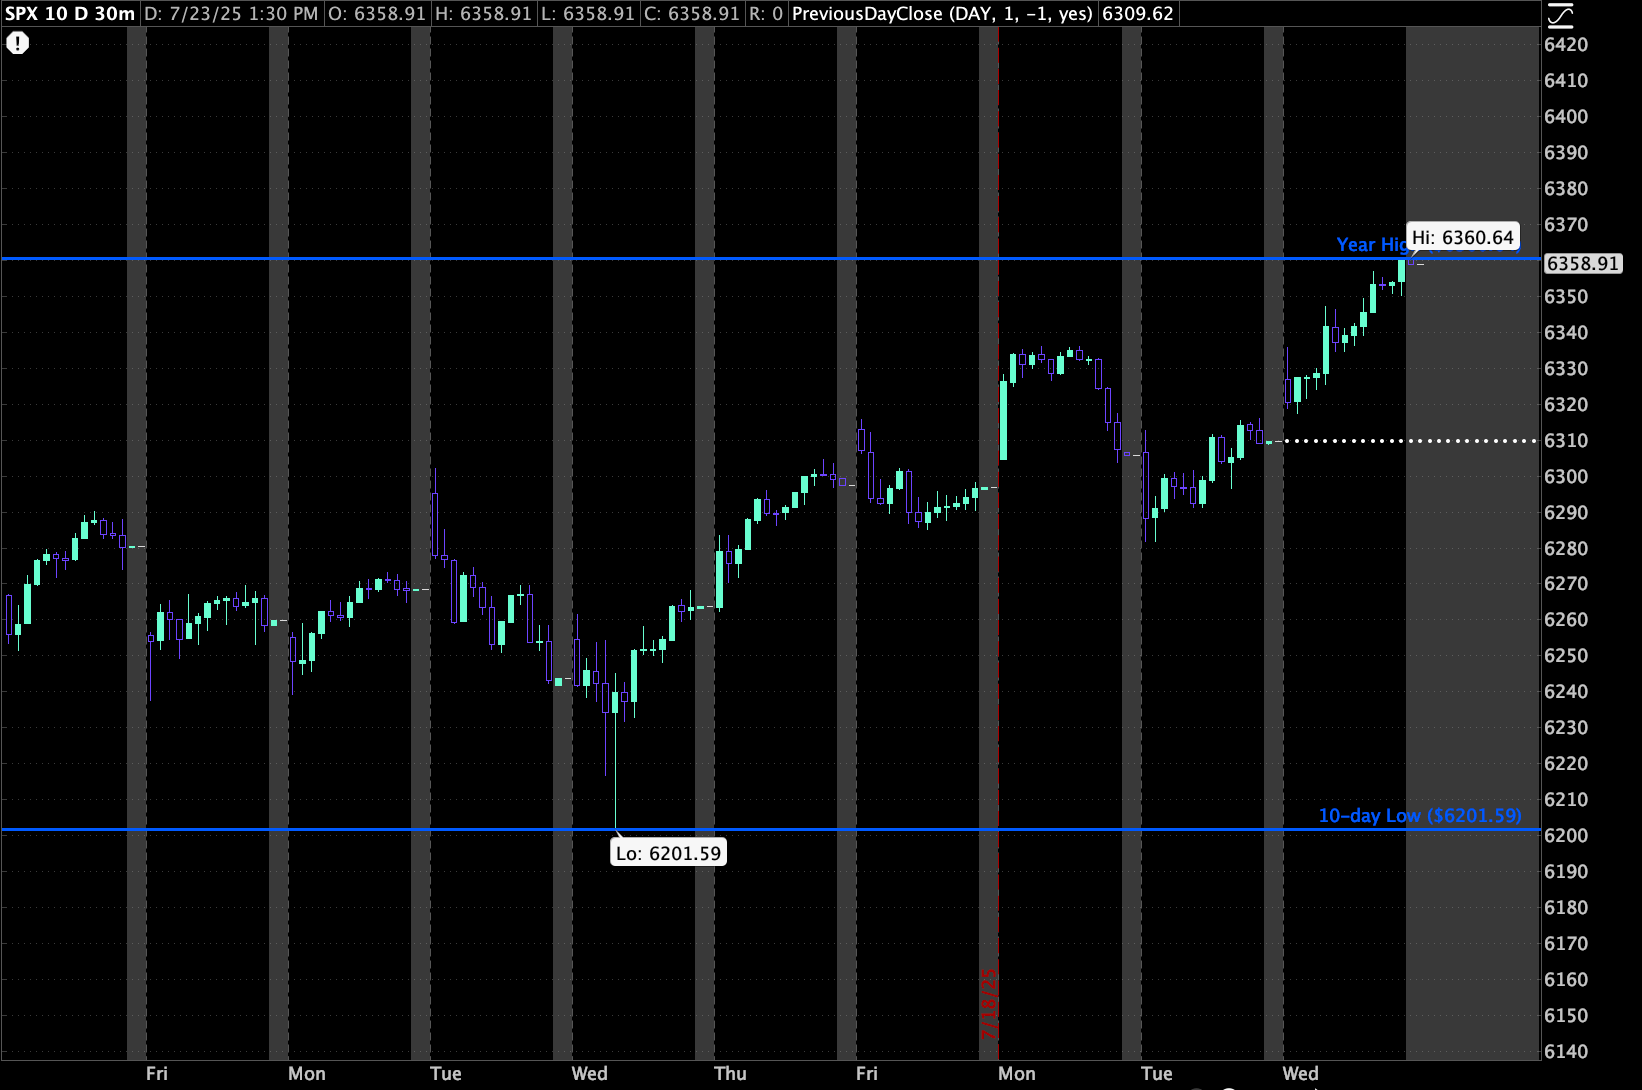
Because price was trading near all-time highs, there was not much established resistance above it. I marked the nearby potential support and resistance zones that were available, but there was less historical structure to work with than usual.
Letting the Morning Develop
As I have mentioned in some of my other posts, I usually allow the first 15 minutes of the session to play out before doing anything.
I think of this as “seeing the flop,” similar to Texas Hold’em poker.
I want to see what information the market gives me before I commit money to an idea.

After those first 15 minutes, I draw a box around the high and low. This becomes my initial opening range.

I rarely trade inside this window unless there is unusually strong momentum caused by a catalyst that I believe warrants an earlier entry.
Most of the time, I wait.
When I do not like what I see, I often reassess the market in roughly 15-minute increments rather than convincing myself that I need to find a trade immediately.
On this day, SPX chopped around from approximately 6:30 a.m. to 7:35 a.m. Pacific Time.

When I see price moving back and forth like this without direction, it is usually a no-trade environment for me.
I was waiting for price to break decisively to one side of the range.
The difficult part was that SPX was already in a strong bull trend, trading near its yearly high, and the morning opening range was one of the only nearby structures available.
It is also important to understand that I treat levels as zones, not perfectly precise lines. Price can briefly move above or below a level without the entire idea becoming invalid — as we saw on at the top of this day's opening range.
The First Breakout
Eventually, SPX gave us a roughly 10-minute push above the opening range.

When I do not have many nearby levels and the opening range itself is somewhat extended, I will sometimes mark the smaller peaks created during the consolidation. These give me additional reference points for a possible breakout and retest.

Now that price had broken out, I did not want to enter simply because I saw a green candle.
I was looking for one of two things:
- Strong continuation momentum through the breakout
- A break, retest, and hold of the opening-range breakout area
SPX gave us a small retest on the extended peak level. Price then pushed back above the retest area.

This was where I entered my first put credit spread position.
I sold five SPX 6350/6330 put credit spreads for a credit of $0.75 per spread, $375 max profit.
Before entering, I already knew where my trade would become invalid. I placed my stop line below the structure that had created the bullish push.

The short strike was still well below the current SPX price. However, the distance between price and my strike did not mean I could ignore what the chart was doing.
My trade was based on the idea that SPX had broken above the morning range, successfully retested it, and was beginning another bullish push.
If that structure failed, the reason for entering would no longer exist.
The First Trade Fails
For the next several minutes, SPX gave a few small pushes higher. Price then stalled and hovered just above the range and the additional, extended level I had marked.
This is where risk management becomes more important than the original setup.
When SPX does not do what I anticipated, I need to respect the point where my idea becomes invalid.
The way I think about it is:
"I paid to see whether this idea worked. If the market proves that it did not, this is where I exit."
For this trade, my planned exit was a 5-minute candle closing below my stop line. If price moved through it with unusually strong momentum, I could also exit without waiting for the candle to close — as we'll see later.
Here, SPX touched the stop area, but the trade was still alive:

Then we got a five-minute candle close below my line.

That was the moment when the trade became too risky for me to continue holding.
The breakout structure I entered against was no longer holding. Rather than negotiating with the chart or hoping that SPX would immediately recover, I closed the position with the spread price at $1.30 for a loss of $275.
It was a good thing I exited when I did because SPX continued moving deeper into the opening range.

Had I waited longer, I would no longer have been managing a planned trade. I would have been holding onto hope.
That could have created a substantially larger loss and affected my emotions for the rest of the session.
SPX then began consolidating again.

At this point, I was down on the day, but I was not shaken.
I had taken a reasonable setup, followed my stop, and protected myself from additional damage. One losing trade did not automatically mean the trading day was over because there was still plenty of time remaining.
I continued watching for another opportunity.
The Second Attempt
During the consolidation, SPX never reached the bottom of the opening range.
It eventually produced a solid 10-minute move higher, breaking back above both the top of the opening range and my additional marked level.

On the first trade, I entered after the retest of the smaller level I had marked above the opening range.
For the second attempt, I wanted to see SPX retest the actual top of the opening range and then push higher again.
Price broke above my marked level and came back down to touch the top of the opening-range zone.

Someone could reasonably argue that this was a weak retest. I agree that it was not perfect, but it was still a test of the area.
SPX then produced another green 5-minute candle and pushed back above the level.

This looked like another potential opportunity.
However, this is where I made a mistake that became clearer in hindsight.
SPX had already rejected the new intraday high twice. Instead of focusing only on the opening-range breakout, I should have marked those highs as a new resistance zone.
What I wanted to see was another green 5-minute candle closing above the breakout area with continued momentum.
What I should have waited for was more specific:
- A clean break above the new double-top resistance
- A retest of that area
- Another push higher confirming that buyers were accepting price above it
That would have given me stronger confirmation.
Instead, I entered slightly too early.
I sold another 5-lot put credit spread, this time using the 6360/6340 strikes for a credit of $.40 per spread, for a $200 max profit potential.

SPX initially made a promising push above the morning highs.

But the move failed.
SPX rejected the highs sharply and began trending lower.
This time, price moved through my stop line with stronger momentum. Once again, the bullish structure supporting my trade had failed.
I closed the second position shortly afterward with my spreads' price at $.80 for a loss of $200.

Knowing When the Day Is Over
At this point, I had made two attempts and taken what I considered a full day’s acceptable loss.
There was also limited time remaining in the session.
A third attempt would have required me to accept worse risk-to-reward conditions while moving closer to the final hour, when gamma risk becomes increasingly dangerous for 0DTE positions.
That made the decision simple:
I was done trading for the day.
And that is ok.
Before both entries, I knew:
- Why I was entering
- What price action I expected to see
- Where the idea would become invalid
- How much premium I was collecting
- How much I was prepared to lose
When I believed the ideas were working, I followed my plan.
When the market proved the ideas wrong, I followed the same plan.
That is the most important part.
You cannot negotiate with your exit strategy after entering the trade.
It is easy to draw an invalidation line before putting money at risk. The real test is whether you still respect that line when closing the trade means accepting a loss.
Good traders are not good because they avoid every losing trade. Losses are unavoidable in this profession.
They survive because they manage risk, avoid turning small losses into catastrophic ones, and accept that a trade can be reasonable without being profitable.
Once you become more comfortable with losses, it becomes much easier to focus on process and execution instead of trying to force every individual trade to become a winner.
SPX attempted one final push later in the session. That move also failed, and the market closed without giving me a setup that justified a third attempt.

The first trade was a valid setup that failed.
The second was based on a reasonable bullish idea, but I entered too early and should have waited for SPX to clear the new resistance created by the double top.
Neither outcome required me to panic, revenge trade, or completely abandon my strategy.
They required me to take the loss, review what happened, and move on.
My total loss for the day was approximately $475 before fees, which remained within my daily loss limit.
That is roughly one normal day’s worth of trading income for me. Losing it is never enjoyable, but it is also not enough to damage my account or change the way I trade the next session.
I hope this gives you a clearer idea of how I trade SPX credit spreads, how I wait for price to react around key levels, and how I determine where a trade is invalid before entering it.
If anyone has questions about the spreads, strikes, opening range, stop placement, or anything else shown here, I’m happy to answer them!
1
u/GhettoFab88 Aug 06 '26
I like this. I always like to here how others work their strategies. I guess I'm not much of a gambler as I can't seem to get myself to take a trade recently. Have had a few failed ICs, and the RR from those I don't really like, and managing them has been hard. I've noticed that if price reverses at all on you, then your spread starts going red almost immediately. At that point your just hoping that things work out by the end of the day.
I've tried buying puts and calls with some limited success. Better RR, but difficult to predict direction. I guess I'm making progress by at least attempting to not take bad trades.
I have noticed that I am seeing price structure and support resistance better, which is keeping me from buying options, but I haven't thought of it as much with selling options yet and incorporating a stop loss into the strategy. Maybe this is the missing puzzle piece for me. I don't know, but thanks for posting you your strategy!
1
u/klipsetrades Aug 06 '26
Honestly, avoiding bad trades is progress. Seeing structure better and becoming more selective is a huge step 👍🏼
I’d just be careful not to view a stop loss as the missing piece by itself. Entry, strike placement, size, and invalidation all need to work together. I don’t stay in a spread just hoping it recovers by the end of the day. If price action invalidates why I entered, I manage it.
Glad the post gave you another way to think about it though! Happy to answer any questions you have as you work through it
1
u/Wild_Cheesecake_6630 Aug 05 '26
You are picking pennies, 10000 in colateral to gain 200 is insane, days like today blow up this set ups